

Two hundred fills and no idea which ones paid
Most futures traders own a broker statement and call it a futures trading journal. It shows fills, commissions, and a running balance. It does not show which contract count produced the profit, which hour produced the drawdown, or whether the size you added last month improved anything. Those three answers are the entire point of keeping records.
Futures make this worse than equities. One ES tick is $12.50, one MES tick is $1.25, and one NQ tick is $5.00. When you scale between 1 and 3 contracts on discretion, your dollar P&L stops describing your edge. It describes your sizing habits. Those are two different problems with two different fixes.
Why the dollar column lies
Traders review a futures trade log in dollars because dollars are what hits the account. The problem is that dollars blend two variables: how good the trade was, and how many contracts you happened to hold. Blend them and you lose the ability to test either one.
Here is the specific failure. Discretionary size increases cluster around conviction, and conviction clusters around momentum, news, and revenge. Those are usually the lowest-expectancy conditions in the log. So the trades carrying 3 contracts sit in the worst bucket, and the trades carrying 1 contract sit in the best. Your per-trade expectancy looks acceptable. Your per-contract expectancy is quietly negative.
Run the test. Compute expectancy two ways from the same 200 rows. First, normalise every trade to one contract and average it — call that flat expectancy. Second, divide actual net P&L by total contracts traded — call that size-weighted expectancy. If size-weighted comes in more than 25% below flat, your sizing is inverted. You are not scaling into your edge. You are scaling into your noise, and adding contracts is subtracting money.
I have yet to see a trader fix that gap by finding a new setup. It is a position sizing problem, and it lives in a field most journals never populate.
What a futures trading journal actually has to compute
Four numbers carry the weight. Everything else is decoration.
Expectancy per contract. (Win rate × average win per contract) − (loss rate × average loss per contract). Per contract, always. A proper expectancy calculation answers whether the setup pays. Dollar expectancy answers whether you got lucky with size.
Profit factor by tag, not by account. Gross profit divided by gross loss on a subset — one session, one setup, one contract count. An account-level profit factor of 1.28 usually hides a 1.9 bucket subsidising a 0.7 bucket.
Drawdown tracking with attribution. Peak-to-trough dollars is half the metric. The other half is which tag produced it. Look at the equity curve dip and ask what percentage of that decline came from trades above your baseline size.
MAE distribution. Maximum adverse excursion in ticks on winners tells you whether your stop is placed where the market actually turns. If 80% of winners never exceed 9 ticks of heat and your stop sits at 20, you are funding a buffer you never use.
The review process, filter by filter
Weekly, not daily. Daily reviews of futures data produce sample sizes too small to mean anything, and they encourage tinkering.
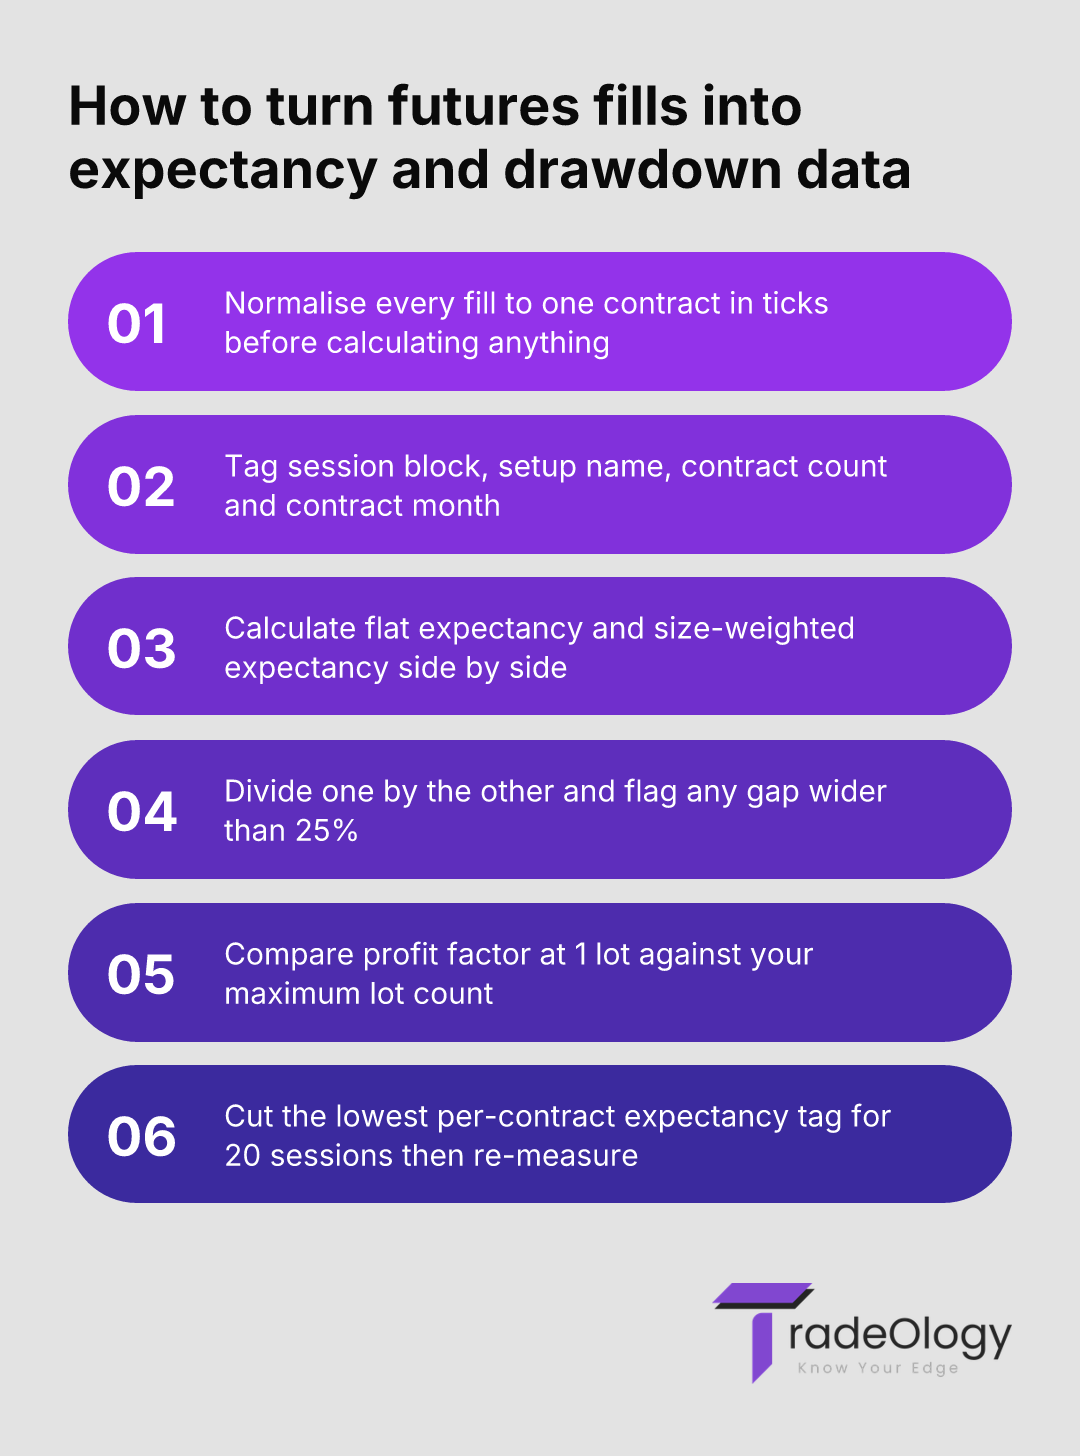
Normalise every row to a one-contract equivalent in ticks before you calculate anything.
Calculate flat expectancy and size-weighted expectancy side by side, then divide one by the other.
Tag each trade with session block, setup name, contract count, and contract month.
Filter by contract count and compare profit factor at 1 lot versus your maximum lot.
Eliminate the tag with the lowest per-contract expectancy for 20 sessions and re-measure.
The contract month tag matters more than traders expect. Roll week distorts liquidity and spread behaviour, and the quarterly ES and NQ roll follows a fixed schedule published by CME Group. If your March 2026 roll week shows a 6-tick wider average slippage, that is not a strategy result. It is a calendar result, and it belongs in its own bucket.
Metric to meaning
Metric | What it actually means | Action to take |
|---|---|---|
Size-weighted expectancy 25%+ below flat | You add contracts on your worst conditions. | Freeze size at 1 lot until the gap closes under 10%. |
Profit factor 1.9 at 1 lot, 0.8 at 3 lots | Execution degrades with size, not the setup. | Cap size at the last lot count above 1.3 profit factor. |
70%+ of drawdown from 30% of trades | One tag is carrying your whole risk profile. | Halve risk on that tag and re-measure after 30 trades. |
Winner MAE under 9 ticks, stop at 20 | Your stop is wider than the market requires. | Tighten to 12 ticks and track the new win rate for 40 trades. |
Roll-week slippage 6 ticks above baseline | Calendar cost is being logged as strategy loss. | Tag roll week separately or stand down for those sessions. |
A $50,000 account, one quarter, 212 ES trades
Real numbers from a review I ran in early 2026. Account $50,000, ES only, 1 to 3 contracts at discretion.
Headline stats: 47% win rate, average win $310, average loss $215, expectancy $31.75 per trade, profit factor 1.28. Net $5,336 for the quarter, 10.7% on the account. A tolerable-looking curve.
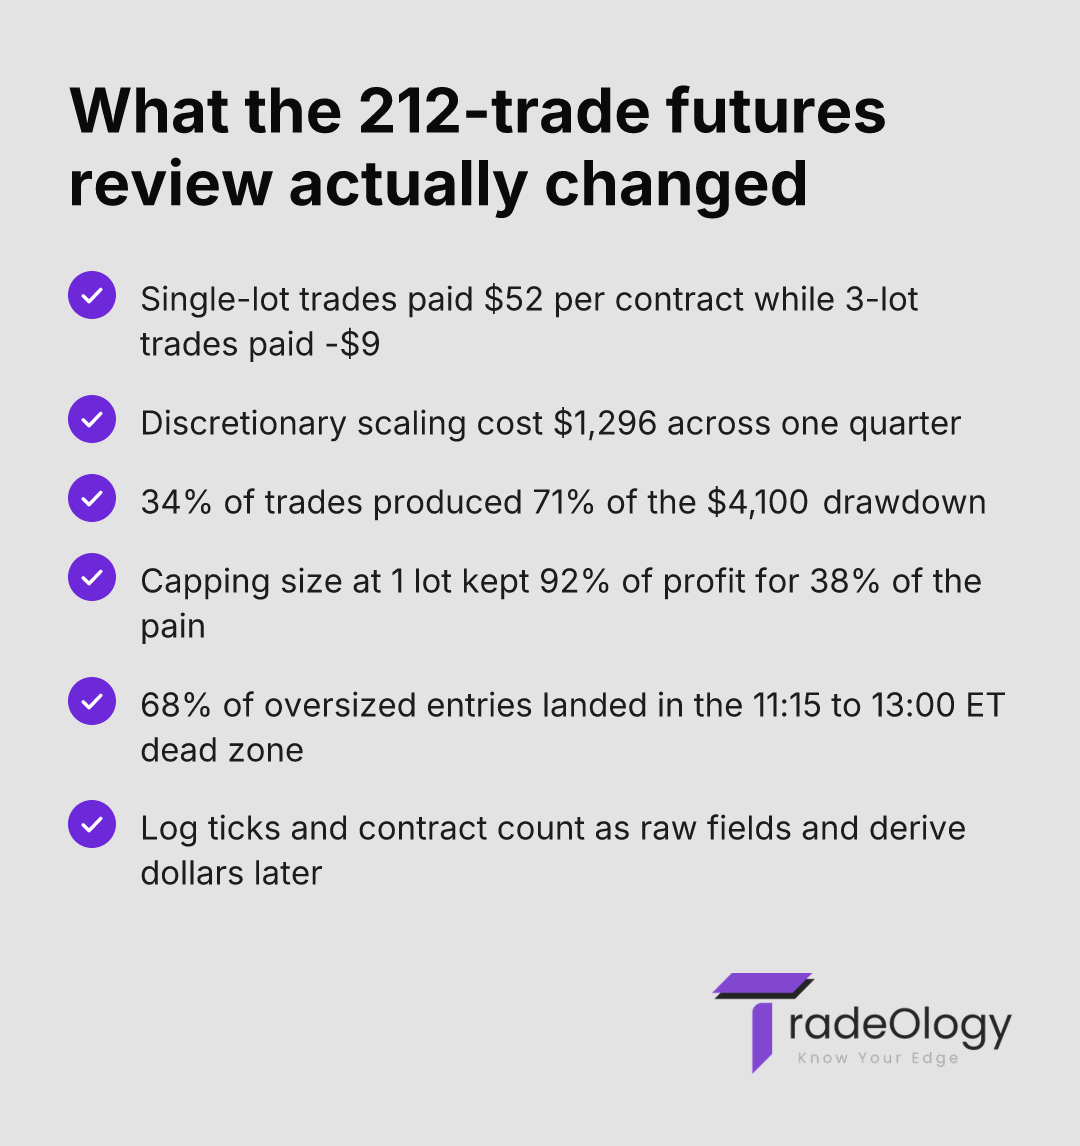
Then split by contract count. On 140 single-contract trades, expectancy was $52 per contract. On 72 three-contract trades, expectancy was negative $9 per contract. Had every trade been taken at 1 lot, the quarter returns $6,632. His scaling cost him $1,296 while tripling his risk exposure on a third of his trades.
Drawdown told the same story from the other side. Peak-to-trough was $4,100, or 8.2% of the account. The 3-lot trades were 34% of trade count and 71% of that decline. He had been reading the equity curve as a volatility problem. It was a sizing problem with a timestamp: 68% of the 3-lot entries landed between 11:15 and 13:00 ET, his lowest-expectancy block.
If your size-weighted expectancy sits more than 25% below your flat, one-contract expectancy, your journal has already proven you scale into your worst ideas. No new setup fixes inverted sizing.
He capped size at 1 contract for six weeks. Same setups, same hours. Net came in at $4,910 on a peak-to-trough of $1,780 — 62% less pain for 92% of the money. That is a Sharpe improvement you can feel in your decision-making, not just in a spreadsheet.
Mistakes that keep futures logs useless
Logging dollars without contract count. The row becomes unusable for any per-contract calculation. Permanently.
Mixing ES and MES in one bucket. A 10-tick MES loss and a 10-tick ES loss are the same trade and a 10× different number.
Recording entries and exits but never MAE. You lose all ability to test stop placement, which is the cheapest edge available in futures.
Writing feelings instead of fields. Narrative without structured tags cannot be filtered, and unfilterable notes are dead weight — the exact problem covered in this breakdown of bad journal data.
Reviewing 15 trades and changing the strategy. At that sample size, the standard error swamps the signal. Wait for 40 per tag minimum.
Where TradeOlogy fits
Normalising 212 futures fills to per-contract ticks by hand takes an evening, and most traders quit after two weeks. TradeOlogy imports the fills, holds contract count as a first-class field, and computes flat versus size-weighted expectancy without you rebuilding formulas. Filter by session block, setup tag, or lot count and the profit factor and drawdown attribution recalculate on the subset.
The software does not decide anything. It removes the arithmetic excuse. If you want the distinction between a record and an analytical tool, this comparison covers it, and this piece covers what tooling cannot repair.
FAQ
Why does my expectancy turn negative when I add contracts?
Because discretionary size increases usually follow conviction, and conviction follows momentum or frustration rather than statistical edge. Filter your log by contract count and compare per-contract expectancy at each level. If the 3-lot bucket underperforms the 1-lot bucket, the setup is fine and your size trigger is broken.
How many futures trades before the numbers are trustworthy?
Roughly 40 trades per tag for a directional read, 100 or more before you commit real capital changes to it. Below 30, a single 4R outlier can swing profit factor by 0.3 and reverse your conclusion entirely.
Should I journal in ticks, dollars, or R-multiples?
Log ticks and contract count as raw fields, then derive dollars and R from them. Ticks let you compare ES against MES and across contract months. Dollars alone destroy that comparability the moment your size varies.
Does contract rollover week distort my journal statistics?
Yes, and often by more than traders assume. Wider spreads and split volume during quarterly rolls can add several ticks of slippage per round turn. Tag roll week separately, or your strategy will be blamed for a calendar cost.
Why track drawdown by tag instead of by equity curve?
An equity curve tells you the depth of the hole. Tagged drawdown tracking tells you who dug it. When 34% of trades produce 71% of the decline, capping one tag repairs the curve without touching your strategy.
The standard
Open your log and add one column: contracts. Then compute expectancy twice. If those two figures disagree by more than a quarter, stop researching setups this month — the data already named your problem. More detail on structuring the record properly sits in this guide.
Verdict: A futures trading journal earns its place only when it separates edge from size, and the divergence between flat and size-weighted expectancy is where that separation shows up. Most futures traders do not have a strategy problem. They have a sizing problem their records were never built to detect.