

Your P&L Is Bleeding. Your Trading Journal Knows Why. You Are Ignoring It.
Let’s be honest about your trading journal. It’s a spreadsheet or a notebook filled with entry prices, exit prices, and maybe a generic note like “hit target” or “stopped out.” You update it, feel a false sense of productivity, and then repeat the same undisciplined actions the next day. This is not analysis. It is record-keeping. It is a waste of time and it is costing you money.
Your journal is not a tool for reflection. It is an objective database of your trading behavior. If your equity curve is erratic, it’s not because of the market. It’s because of a flaw in your process. That flaw is recorded in your trade log, staring you in the face. You just refuse to see it. This article is not about starting a trading diary. It is about turning that graveyard of data into an actionable diagnostic tool that fixes your P&L.
You Think Logging Trades Is Analysis. It Is Not.
Most traders treat their journal like a confessional. They write down what they did, feel a momentary sense of release, and learn nothing. The core mistake is believing that the act of recording is the same as the act of analysis. It is not. This is why you keep making the same errors.
You take an impulsive trade, outside your plan. You log it. You might even write "bad discipline" in the notes. Then what? Nothing. The next week, the same setup appears, the same impulse fires, and you take the same bad trade. The journal recorded the mistake, but you never built a system to prevent its recurrence.
The consequence is a permanently stalled learning curve. You are stuck in a loop of symptom-logging without ever diagnosing the disease. Your results are random because your process is inconsistent. Your trading journal is supposed to be your most crucial tool, but you have turned it into a monument to your mistakes instead of a blueprint for fixing them.
What Actually Matters: Actionable Metrics, Not Vanity Metrics
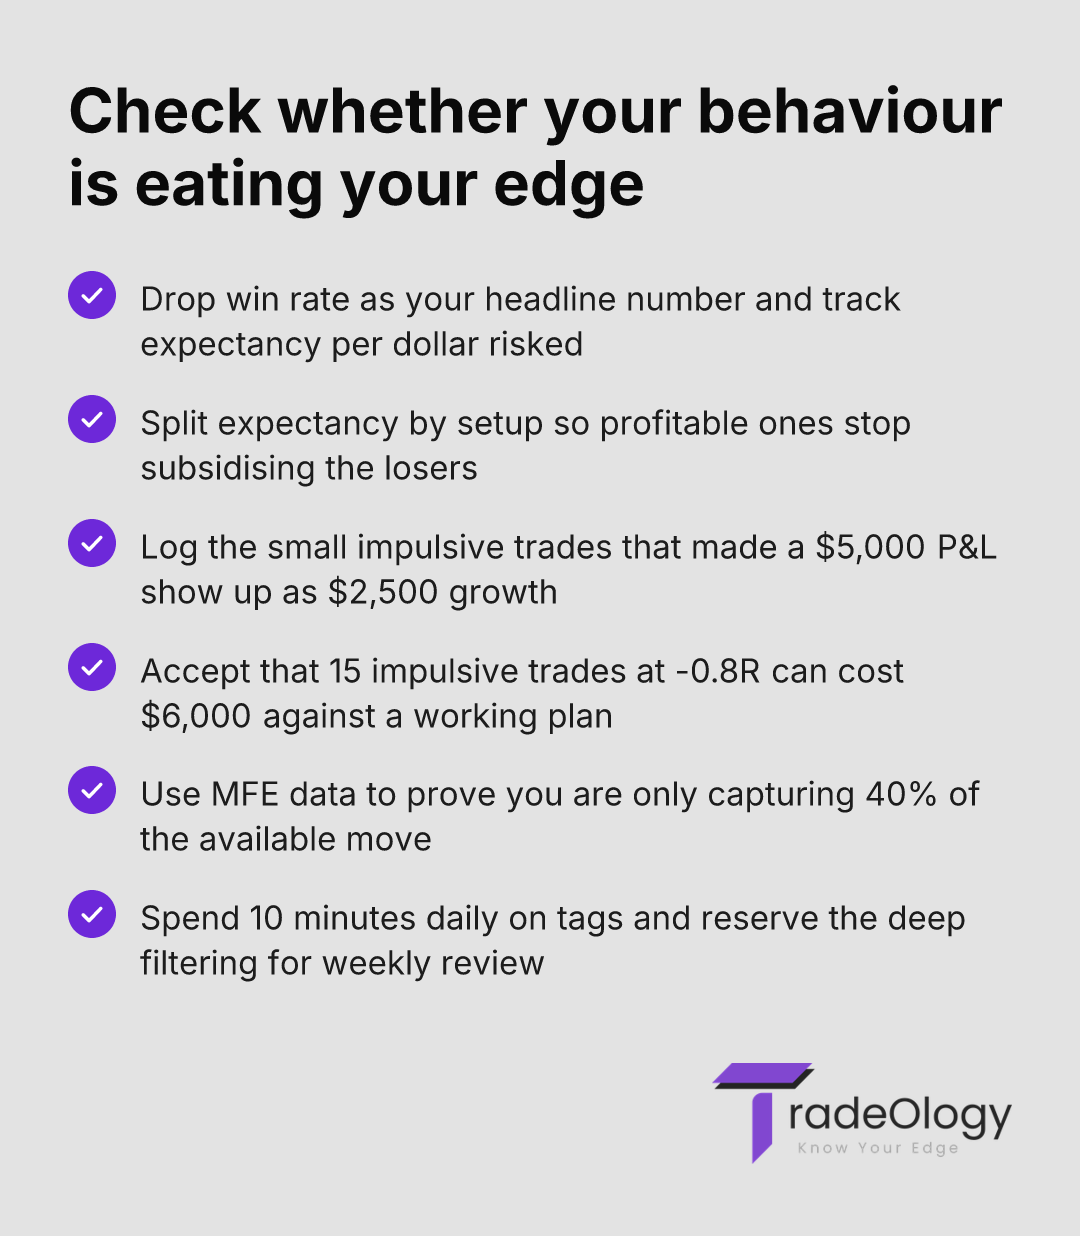
Stop focusing on win rate. It is a vanity metric that tells you almost nothing about your profitability. A high win rate with poor risk-reward will still drain your account. Your journal must answer one primary question: "What is my system's expectancy?"
Expectancy tells you what you can expect to make (or lose) on average for every dollar you risk. If you are not tracking it, you are flying blind. Read that again. Find it in our guide on calculating and improving trading expectancy if you have to.
But you must go deeper. Your process has holes. Here is where they leak:
Expectancy by Setup: You trade three different setups. What is the expectancy for each one? Your journal will likely show that one setup is highly profitable while the other two are bleeding you dry. The data forces a decision: fix the losing setups or eliminate them.
Performance by Day/Time: Are you giving back all your week's gains on Friday afternoon? Are you taking impulsive trades during the first 15 minutes of the market open? Your journal data, when filtered, exposes these patterns.
MAE/MFE Analysis: Maximum Adverse Excursion (how far a trade moves against you) and Maximum Favorable Excursion (how far it moves in your favor). Are you consistently letting winning trades turn into losers? MFE data proves it. Are your stop losses too tight or too wide? MAE data gives you the answer. This isn't theory; it's your real-time performance data.
This is what a real trading journal does. It moves you from "I think I have a problem with..." to "My data shows I lose an average of $0.30 for every $1 risked on my reversal setup." One is a feeling. The other is a fact that forces change.
A Review Process That Actually Fixes Errors
A profitable review process is not a casual scroll through your last 20 trades. It is a systematic interrogation of your data. It requires structure.
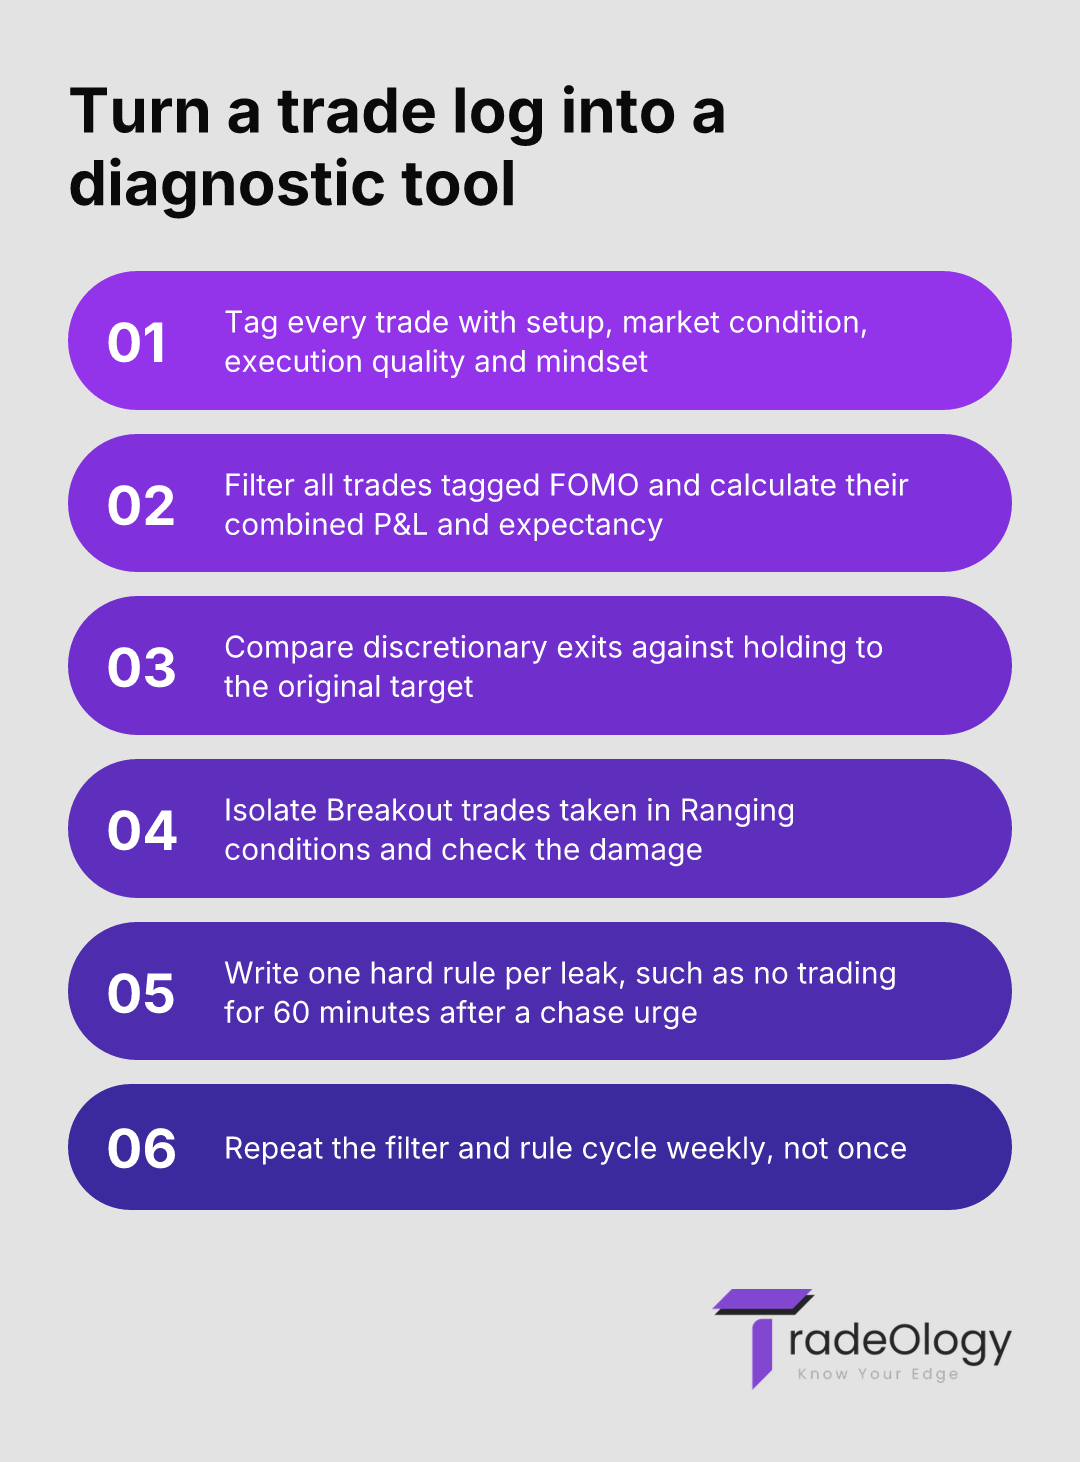
Step 1: Tagging Beyond the Obvious
Every trade must be tagged with more than just the setup name. Create a standardized set of tags to track the *conditions* of your trading. Your tags are the foundation of your entire analysis.
System Tags: Setup Name (e.g., "Breakout," "Mean Reversion"), Asset Class, Market Condition (e.g., "Trending," "Ranging").
Execution Tags: Entry (e.g., "Clean," "Chased"), Exit (e.g., "Target Hit," "Stopped Out," "Discretionary Exit").
Psychology Tags: Mindset (e.g., "Focused," "Impatient," "FOMO," "Revenge Trading"). Be brutally honest here.
Step 2: Filter Ruthlessly
This is where the work happens. Your goal is to isolate variables to find weak points. Ask specific questions and use your tags to filter for the answers.
Filter for all trades tagged "FOMO." What is their combined P&L? What is their expectancy?
Filter for all trades where you used a "Discretionary Exit." Did you make more or less than if you had held to your original target?
Filter for all "Breakout" trades that occurred in "Ranging" market conditions. The results will tell you to stop forcing trades that don't fit the environment.
Step 3: Connect Data to Behavior
The filtered data is not the end point. It is the diagnostic tool. The final step is to create a rule to fix the leak.
Data Point: "My 'FOMO' trades have a -$0.45 expectancy."
New Rule: "If I feel the urge to chase an entry, I am not permitted to trade for the next 60 minutes. I will close the platform."Data Point: "I consistently exit trades too early, capturing only 40% of the potential MFE."
New Rule: "I will set my target and stop loss and not touch the trade until one is hit. My trade review process shows my initial plan is better than my in-trade decisions."
This is not a one-time fix. This is your new weekly process. You don’t need more motivation. you need better data and stricter rules.
Real Example: How a Journal Exposes a $6,000 Leak
A trader has a $50,000 account. They risk $500 per trade (1%). Over a month, they take 40 trades and end with a profit of $2,500. Not bad. But their equity curve is a rollercoaster.
Their basic journal shows:
22 Wins: +$14,500
18 Losses: -$9,000
Commissions: -$500
Net P&L: +$5,000
Wait, the P&L is $5,000 but the account only grew by $2,500? Where did the other $2,500 go? The trader forgot to log the small, impulsive trades that "didn't count."
A proper trading journal with tagging reveals the truth:
Trades matching Plan A (25 trades): +$8,500 P&L, +0.6R expectancy.
Trades taken impulsively (15 trades): -$6,000 P&L, -0.8R expectancy.
The problem is now crystal clear. The core strategy is profitable. The trader's undisciplined behavior is a catastrophic leak, costing them more than their winning system is making. Without a detailed journal, this trader would spend months trying to "fix" a strategy that was never broken. They are the problem. The journal proves it.
How TradeOlogy Stops the Bleeding
You can do all of this in a spreadsheet. But you won’t. It’s tedious, it’s manual, and it’s prone to the same biases you’re trying to eliminate. This is not a sales pitch. It is a process upgrade.
TradeOlogy automates the entire data-capture and analysis workflow. You connect your broker, and we handle the rest. Your job is not data entry. Your job is analysis.
Automated Logging: We import your trades directly. No more forgotten trades. No more manual entry errors. The data is complete and objective.
Effortless Tagging: Apply your custom tags—setup, mindset, execution—with a single click. The platform remembers them for your next review.
Instant Analytics: Stop building pivot tables. We calculate your P&L, expectancy, win rate, and risk-reward for any filter set you apply. Want to see the expectancy of your ‘Revenge Trades’ on Tuesdays? It takes two clicks.
Visual Pattern Recognition: Our dashboards visualize your performance. See at a glance which setups are profitable and which are not. Spot the behavioral patterns costing you money without digging through rows of data.
The platform doesn't make decisions for you. It forces you to confront the objective truth of your performance and frees up your mental capital to focus on building better rules and habits. It automates the logging so you can focus on the learning.
Frequently Asked Questions
How often should I review my trading journal?
Log your trades daily, with psychological notes and tags, while the memory is fresh. This takes 10 minutes. Perform your deep-dive analysis weekly. This is where you filter, question the data, and build new rules for the week ahead. A monthly and quarterly review should focus on higher-level strategy performance and drawdown analysis.
What’s more important to track: my setups or my emotions?
Both are critical, and they are linked. Tracking setups tells you if your strategy has a statistical edge. Tracking emotions tells you if *you* are capable of executing that strategy. A profitable system is useless if your psychological state prevents you from following its rules. The journal shows you where behavior sabotages strategy.
My journal shows my strategy has a negative expectancy. What now?
Good. You just saved yourself months or years of continued losses. The journal has done its job. The data is clear: your strategy, as you are trading it, is not viable. Your options are now data-driven, not based on hope. You can now begin to properly evaluate a trading strategy by isolating variables to see what is failing (e.g., poor stop loss placement, wrong market conditions) or you can discard the strategy entirely and begin developing a new one with a clear performance baseline to beat.
Your Journal Is a Contract With Yourself
Stop treating your trading journal like an archive. It is not a history book. It is a forward-looking diagnostic tool designed to break cycles of failure. It provides the data-driven foundation for every trading decision you make, from position sizing to system refinement. Maintaining a lazy, incomplete journal is a choice. It is a decision to remain an amateur. A rigorous, analytical journal is the bedrock of a professional trading career. The choice is yours.