

When it comes to trading expectancy, understanding the fundamentals is essential for any trader.
What Is Trading Expectancy and How Do You Calculate It?
As traders, we live and die by our system’s edge. But how do you measure that edge? It’s not about your win rate, how you feel, or that one massive win you had last month. The ultimate measure of a trading system's profitability is its trading expectancy. This single metric tells you what you can expect to make or lose, on average, for every single trade you take. If you don’t know this number, you are essentially flying blind. Understanding your trading expectancy is the first step toward treating your trading like a business, moving from inconsistent gambling to a structured, data-driven approach. It separates the traders who last from those who burn out after a few bad months. A positive expectancy means you have a statistical edge over the long run, even with losing trades. A negative one means you are on a slow road to ruin.
The Expectancy Formula
(Win Rate x Average Win Size) – (Loss Rate x Average Loss Size) = Expectancy
For example, if you have a 40% win rate and your average winner is $300, while your average loser is $100: (0.40 x $300) – (0.60 x $100) = $120 - $60 = $60. Your trading system has a positive expectancy of $60 per trade.
The Problem: Trading Without Knowing Your Edge
Too many traders focus exclusively on their win rate. They chase systems that promise 80% or 90% accuracy, not realizing that a high win rate is meaningless if the losses are catastrophic. Imagine a trader who wins 9 out of 10 trades, pocketing $50 each time. They feel invincible. But on that 10th trade, they let a loser run, finally cutting it for a $600 loss. Let's do the math: (9 x $50) - (1 x $600) = $450 - $600 = -$150. Over 10 trades, they’ve lost $150. Their system has a negative trading expectancy, and they are guaranteed to lose their entire account over time. This is a classic trap. Without understanding the relationship between win rate and the magnitude of wins and losses, traders make disastrous decisions. They cut winners short for fear of them turning into losers and let losers run in the hope they’ll come back to breakeven, fundamentally destroying any potential edge their system might have had. This is why a trader can feel like they are winning most of the time yet see their account balance slowly, or sometimes quickly, bleed out.
A Deeper Look at the Expectancy Formula
Your trading expectancy is the statistical average outcome of your trades over a large sample size. It’s what you can mathematically expect to earn (or lose) per trade. A positive expectancy means your system is profitable over the long term, while a negative expectancy guarantees you'll eventually lose. The formula itself is composed of four critical trading system metrics:
Win Rate: The percentage of your trades that are closed for a profit.
Loss Rate: The percentage of your trades that are closed at a loss (simply 100% - Win Rate).
Average Win Size: The average amount of money you make on your winning trades.
Average Loss Size: The average amount of money you lose on your losing trades.
The formula puts these pieces together to give you a clear, unbiased look at your system’s performance. It shifts the focus from any single trade to the statistical performance of your entire trading operation. For a new system to be considered viable, you should trade it on a demo account or with very small size for at least 50-100 trades to get a preliminary idea of its trading expectancy. This initial data set will tell you if the system is worth pursuing further. Relying on back-tested data alone can be misleading due to factors like slippage and commissions, which are not always accounted for. Real-world execution is the ultimate test.
A Practical Framework for Improving Your Trading Expectancy
Improving your trading expectancy isn’t about finding a magic indicator; it’s about systematically optimizing the four variables in the formula. Here’s a step-by-step framework to do just that.
Step 1: Track Everything Religiously
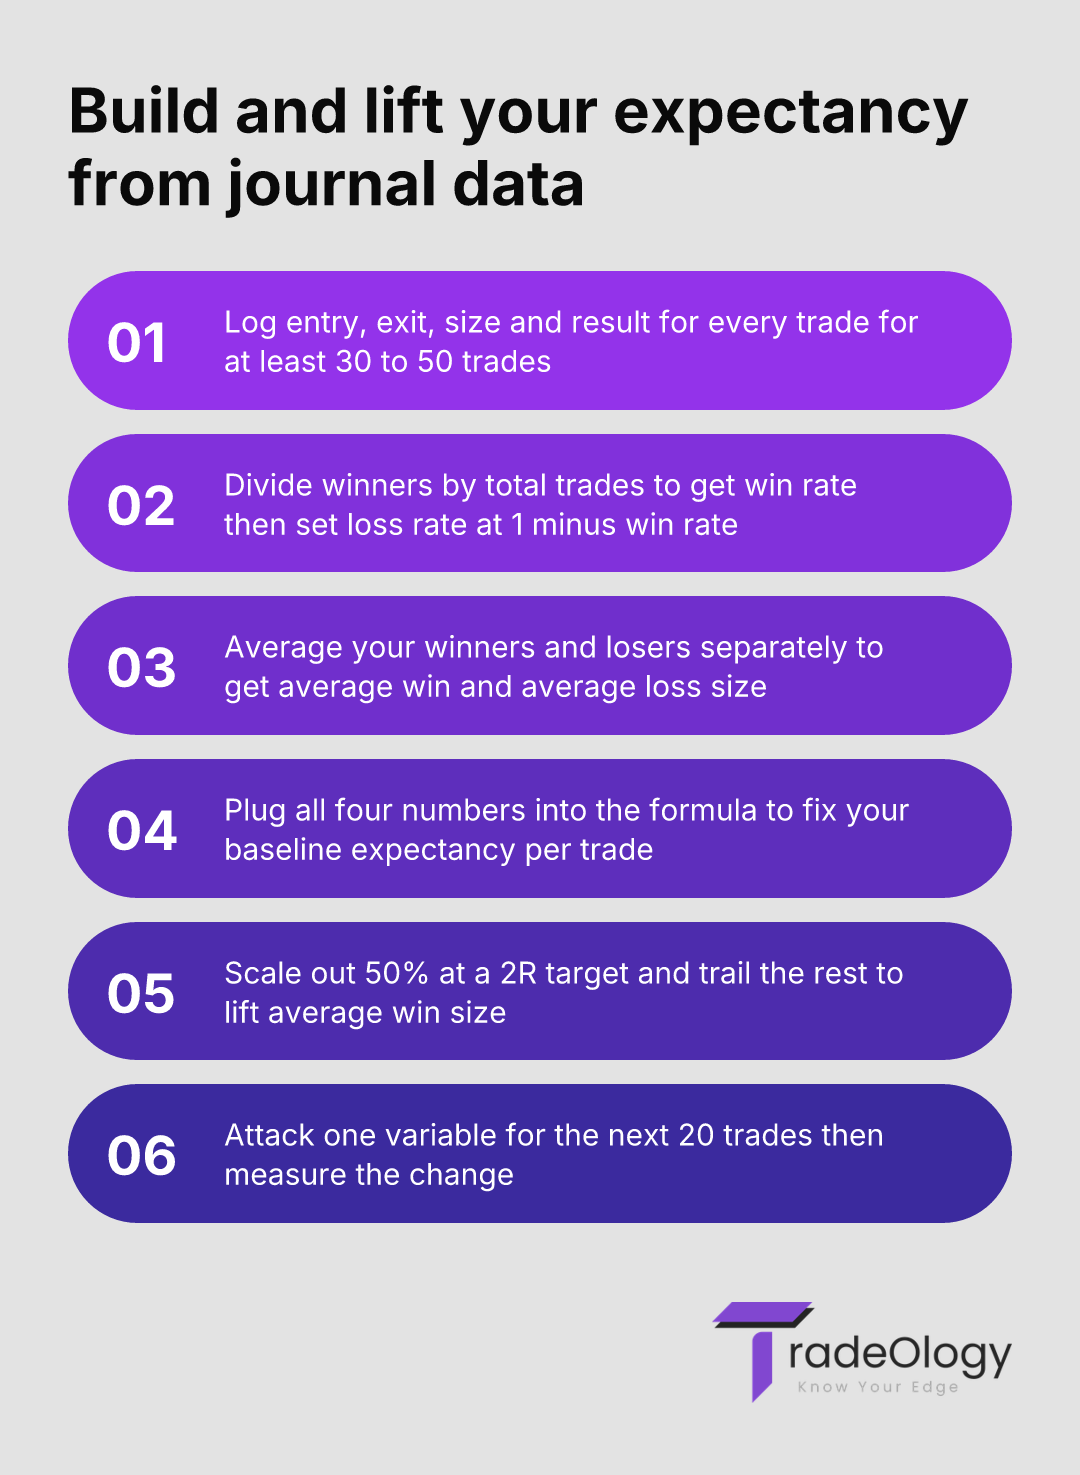
You cannot improve what you do not measure. The first step is to meticulously track every trade. This is non-negotiable. For every trade, you need to log the entry price, exit price, position size, and whether it was a win or loss. A dedicated trading journal is essential. Without a complete data set, any calculation you make is just a guess. After at least 30-50 trades, you can begin your analysis.
Step 2: Calculate Your Baseline Expectancy
Using the data from your journal, calculate your four key metrics:
Sum all your winning trades and divide by the number of winners to get your Average Win Size.
Sum all your losing trades and divide by the number of losers to get your Average Loss Size.
Divide your number of winning trades by the total number of trades to get your Win Rate.
Your Loss Rate is 1 - Win Rate.
Plug these into the expectancy formula. This number is your baseline. Your entire goal from this point forward is to make that number bigger.
Step 3: Systematically Attack the Variables
Now, focus on improving one variable at a time. The beauty of the expectancy formula is that it shows you have four levers to pull.
Increasing Average Win Size: Can you hold your winners longer? Review your winning trades. Did you get out too early based on fear? A common technique is to scale out of positions. For example, sell 50% of your position at a 2R target (twice your risk) and let the rest run with a trailing stop. This can dramatically increase your average win without impacting your win rate.
Decreasing Average Loss Size: Are you respecting your stop losses? Or are you moving them "just in case"? A smaller average loss is often the fastest way to improve expectancy. A strict adherence to your predefined stop-loss is critical. Go through your losing trades and see how many you let go past your initial stop. This is a discipline problem that data will make impossible to ignore. A great resource for understanding risk parameters is Investopedia's guide on the risk/reward ratio.
Increasing Win Rate: This is often the hardest variable to change, as it's inherent to the trading strategy itself. However, you can make small improvements by being more selective. Does your data show your setup works better during a specific market session or on certain days of the week? Perhaps avoiding trading around major news events could filter out a few low-probability trades, nudging your win rate higher.
By focusing on one of these areas for a set period (e.g., the next 20 trades), you can measure the impact on your overall trading expectancy and adopt the changes that work.
Real Trading Example: Calculating Expectancy
Let’s walk through a realistic scenario for a trader with a $25,000 account. This trader risks 1% of their account per trade, which is $250. Over the last 50 trades, their journal shows:
Total Trades: 50
Winning Trades: 22
Losing Trades: 28
First, we calculate the win and loss rates:
Win Rate: 22 / 50 = 44% (0.44)
Loss Rate: 28 / 50 = 56% (0.56)
Next, the trader digs into their trade log to find the P&L of each trade. They sum the profits from the 22 winners, which comes to $10,450. They sum the losses from the 28 losers, which comes to -$7,000. Now, we calculate the average win and loss:
Average Win: $10,450 / 22 = $475
Average Loss: $7,000 / 28 = $250 (The trader is disciplined with their stops)
Finally, we calculate the trading expectancy:
Expectancy = (0.44 x $475) – (0.56 x $250)
Expectancy = $209 – $140 = $69
This trader’s system has a positive trading expectancy of $69 per trade. Over these 50 trades, they should have netted approximately 50 x $69 = $3,450, which matches their total P&L ($10,450 in wins - $7,000 in losses). They now have a powerful metric to guide their strategy performance tracking.
Common Mistakes Traders Make with Expectancy
Understanding the concept of expectancy is one thing; applying it correctly is another. Here are common mistakes that can derail even well-intentioned traders:
Focusing Only on Win Rate: As discussed, this is the most common trap. A high win rate feels good, but if your few losses wipe out dozens of wins, you have a losing system. The expectancy formula proves that profitability is a balance.
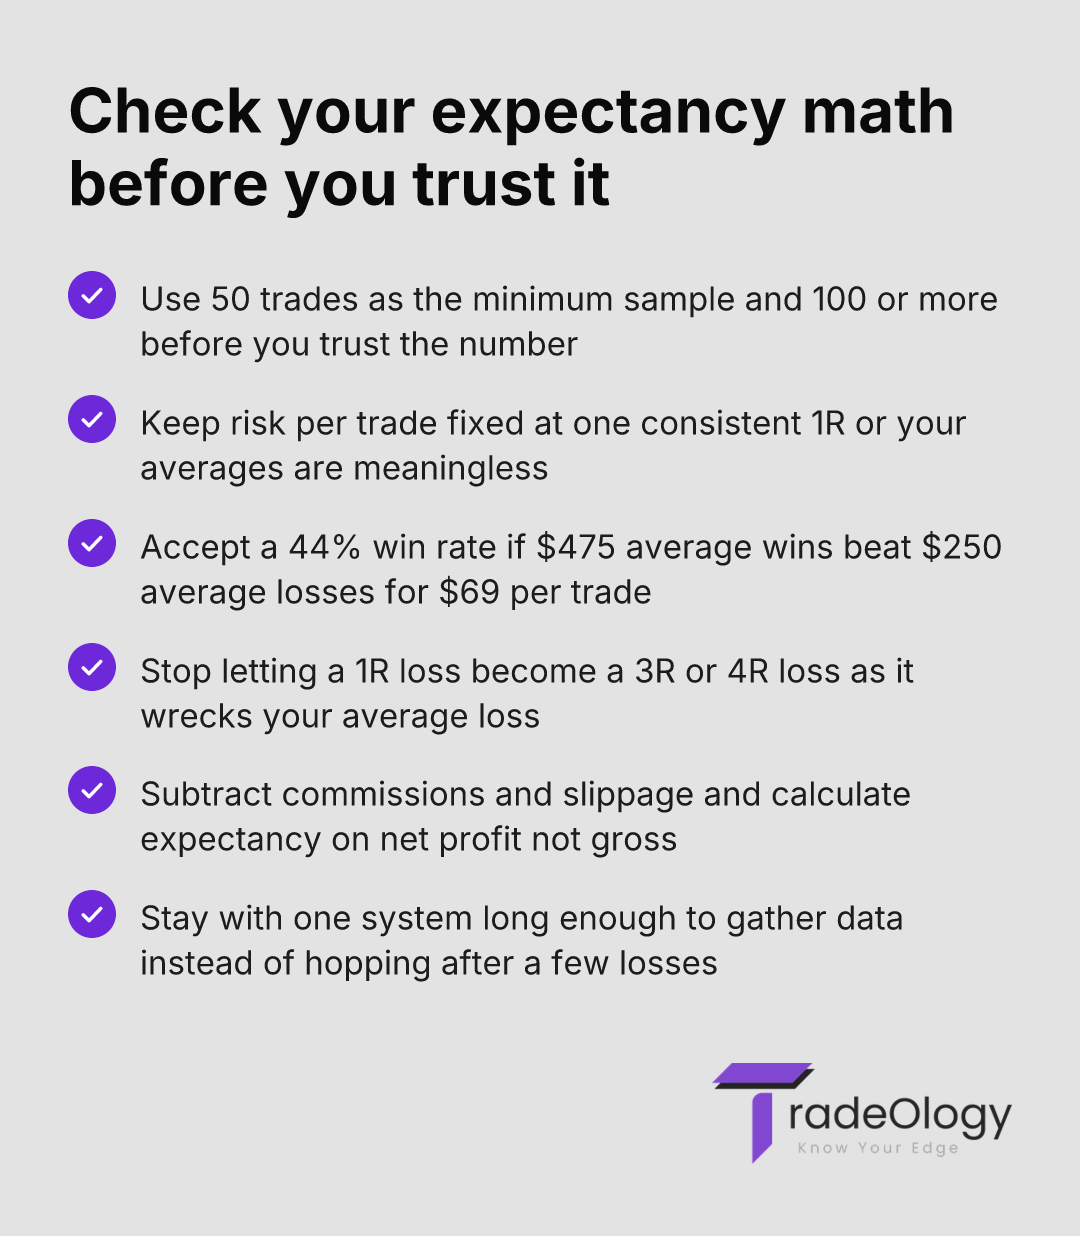
Using a Small Sample Size: Calculating your expectancy after 10 trades is statistically useless. Randomness can give you a winning or losing streak that doesn't reflect the system's true nature. You need a large enough sample (50 trades at a minimum, 100+ is better) to have confidence in the number.
Inconsistent Risk Per Trade: If you risk 1% on one trade, 5% on the next, and 0.5% on another, you can't calculate a meaningful expectancy. Your risk per trade (your "1R") should be a consistent dollar amount or percentage of your account. Inconsistent sizing skews your average win and loss data, making the formula unreliable.
Letting Losers Run: The fastest way to destroy a positive expectancy system is by failing to cut losses. Letting a 1R loss turn into a 3R or 4R loss requires several winning trades just to get back to breakeven. It mathematically devastates your average loss calculation.
Not Factoring in Costs: For active traders, commissions and slippage are real costs that eat into profits. A system with a marginal positive expectancy might actually be a loser once these costs are factored in. True expectancy calculation should use net profits, not gross.
Jumping Between Strategies: Many traders abandon a strategy after a few losses without ever collecting enough data to determine its true trading expectancy. This "system hopping" prevents them from ever knowing if they had an edge. You must stick with a system long enough to gather sufficient data.
How TradeOlogy Helps You Master Your Expectancy
Calculating and improving your trading expectancy requires one thing above all else: clean, consistent data. This is where most traders fail. Manually logging every trade in a spreadsheet is tedious, prone to errors, and difficult to analyze. TradeOlogy is built to solve this exact problem. Our platform automates the data collection process, syncing directly with your brokerage account. Every trade is logged with its entry, exit, size, P&L, and duration. With this foundation, TradeOlogy provides you with powerful analytics that go far beyond simple P&L tracking. It automatically calculates your win rate, average win, average loss, and your system’s overall trading expectancy across any timeframe. You can filter by strategy, by market, or by time of day to see exactly where your edge is strongest. Instead of spending hours wrestling with spreadsheets, you can see instantly how moving your stop-loss or holding a winner longer impacts your bottom line. The platform makes the trade review process objective and data-driven, helping you move past emotional decision-making. Why do most traders fail without a trading journal? Because without data, they cannot calculate their expectancy, and without expectancy, they are simply gambling.
Frequently Asked Questions (FAQ)
What is a good trading expectancy?
Any positive expectancy is "good" because it means you have a profitable system. However, context matters. A high-frequency system making 100 trades a day might be excellent with an expectancy of just $5 per trade. A swing trader making only 5 trades a month would need a much higher expectancy to be worthwhile. The key is that the number must be positive after accounting for all commissions and fees. A simple way to evaluate it is by looking at its relationship to your risk (R). If your risk per trade is $100 and your expectancy is $20, you have a 0.2R expectancy. This is a very healthy edge.
How many trades do I need to calculate a reliable expectancy?
While you can start calculations after about 30 trades, a truly reliable trading expectancy requires a larger sample size to be statistically significant. A minimum of 50 trades is a good starting point, but 100 or more is ideal. The more trades you have in your data set, the more confidence you can have that the calculated expectancy reflects the true performance of your system and isn’t just the result of a lucky or unlucky streak. Consistency is key; a system traded over 200 trades will have a much more predictable expectancy than one traded only 20 times.
My win rate is low. Can I still have a positive expectancy?
Absolutely. This is one of the most important concepts in professional trading. Many successful trend-following systems have win rates as low as 30%-40%. They remain highly profitable because their average win size is many multiples of their average loss size. For example, a system might lose $100 on 6 out of 10 trades but make $500 on the 4 winning trades. Let's calculate the trading expectancy: (0.40 x $500) – (0.60 x $100) = $200 - $60 = $140. Despite winning less than half the time, the system has a very strong positive expectancy of $140 per trade. This is why win rate doesn't matter as much as expectancy.
Conclusion: Your North Star Metric
In the noise and chaos of the markets, your trading expectancy is your north star. It’s the single most important metric for evaluating your performance because it combines the four pillars of a trading system: frequency of wins, size of wins, frequency of losses, and size of losses. It’s an unflinching, data-driven look at your true edge. Chasing high win rates or getting emotional about individual trades is a recipe for failure. Instead, focus on executing your plan flawlessly and methodically working to improve your system’s positive expectancy. By tracking your data, understanding the formula, and making disciplined adjustments, you can move from guessing to knowing. Ultimately, a consistently positive trading expectancy is the only thing that separates a professional trading business from a short-lived hobby.