

When it comes to trading expectancy, understanding the fundamentals is essential for any trader.
What Is Trading Expectancy and How Can It Define Your Long-Term Profitability?
Trader A wins 75% of their trades. Trader B wins only 40%. Who is more profitable? If you immediately said Trader A, you might be leaving serious money on the table. The truth is, a high win rate means nothing without understanding its relationship to risk and reward. Trader B could be consistently profitable if their winning trades are substantially larger than their losing ones, while Trader A might be bleeding capital despite frequent small wins. This mathematical relationship between how often you win and how much you win is the core of trading expectancy. It’s not about the thrill of a single winning trade; it’s about building a sustainable, profitable trading system over hundreds of trades. Understanding and applying this concept is arguably one of the most critical steps in moving from an amateur speculator to a professional trader.
The Trading Expectancy Formula
(Win Rate x Average Win Size) – (Loss Rate x Average Loss Size) = Expectancy
For example, if you win 50% of your trades and your average win is $300, while your average loss is $100, your expectancy is: (0.50 x $300) – (0.50 x $100) = $150 - $50 = $100 per trade.
The Problem: The Dangerous Allure of a High Win Rate
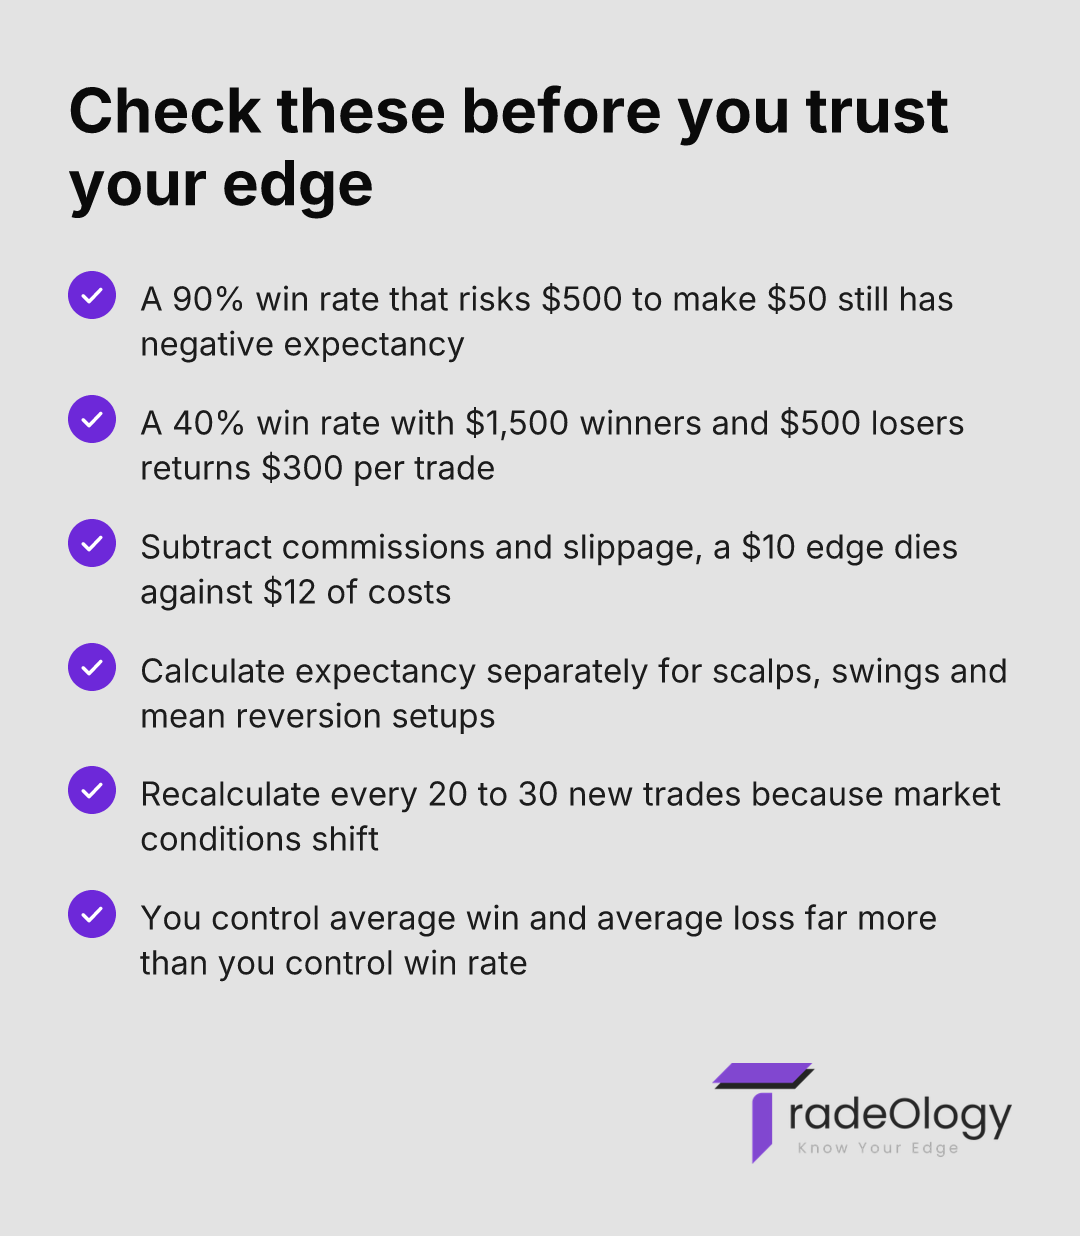
Most developing traders are obsessed with their win rate. They hunt for strategies that promise 80%, 90%, or even higher win percentages. This focus is a critical error because it ignores the other half of the profitability equation: the magnitude of wins versus losses. A strategy that wins 90% of the time sounds fantastic, but if it risks $500 to make $50 on each trade, it has a negative expectancy. One loss wipes out ten wins, making it a guaranteed path to a blown account.
This psychological trap leads traders to cut winning trades short to lock in a "win" and let losing trades run in the hope they’ll turn around, wrecking their risk-to-reward ratio. They fear taking a loss, so they might move a stop-loss "just this once," turning a small, manageable loss into a catastrophic one. A system with a 40% win rate can be exceptionally profitable if the average winner is 3, 4, or 5 times larger than the average loser. The market doesn't reward you for being right; it rewards you for how much money you make when you are right versus how much you lose when you are wrong.
Understanding Your Trading Edge: A Deeper Look at Trading Expectancy
At its core, trading expectancy is the statistical measure of your trading edge. It’s the average amount you can expect to win or lose per trade over a large series of trades. A positive expectancy means your system is profitable over the long run, while a negative expectancy means you are statistically guaranteed to lose money over time, regardless of how good the strategy feels. Having a positive expectancy is the minimum requirement for a viable trading system.
Let's break down the components:
Win Rate: The percentage of trades that are closed for a profit. (Number of Winning Trades / Total Trades)
Loss Rate: The percentage of trades closed for a loss. (Number of Losing Trades / Total Trades)
Average Win: The average monetary gain on your winning trades.
Average Loss: The average monetary loss on your losing trades.
What this formula reveals is that you have four variables to create a profitable system. You can improve your win rate, increase your average win size, decrease your loss rate (which is just the inverse of the win rate), or decrease your average loss size. Profitable traders understand that they have more direct control over the size of their wins and losses (through judicious profit-taking and disciplined stop-losses) than they do over their win rate.
A Practical Framework for Calculating and Improving Your Trading Expectancy
Calculating your trading expectancy isn't a one-time task; it's an ongoing process of data collection and analysis. Here is a step-by-step framework to implement this in your own trading.
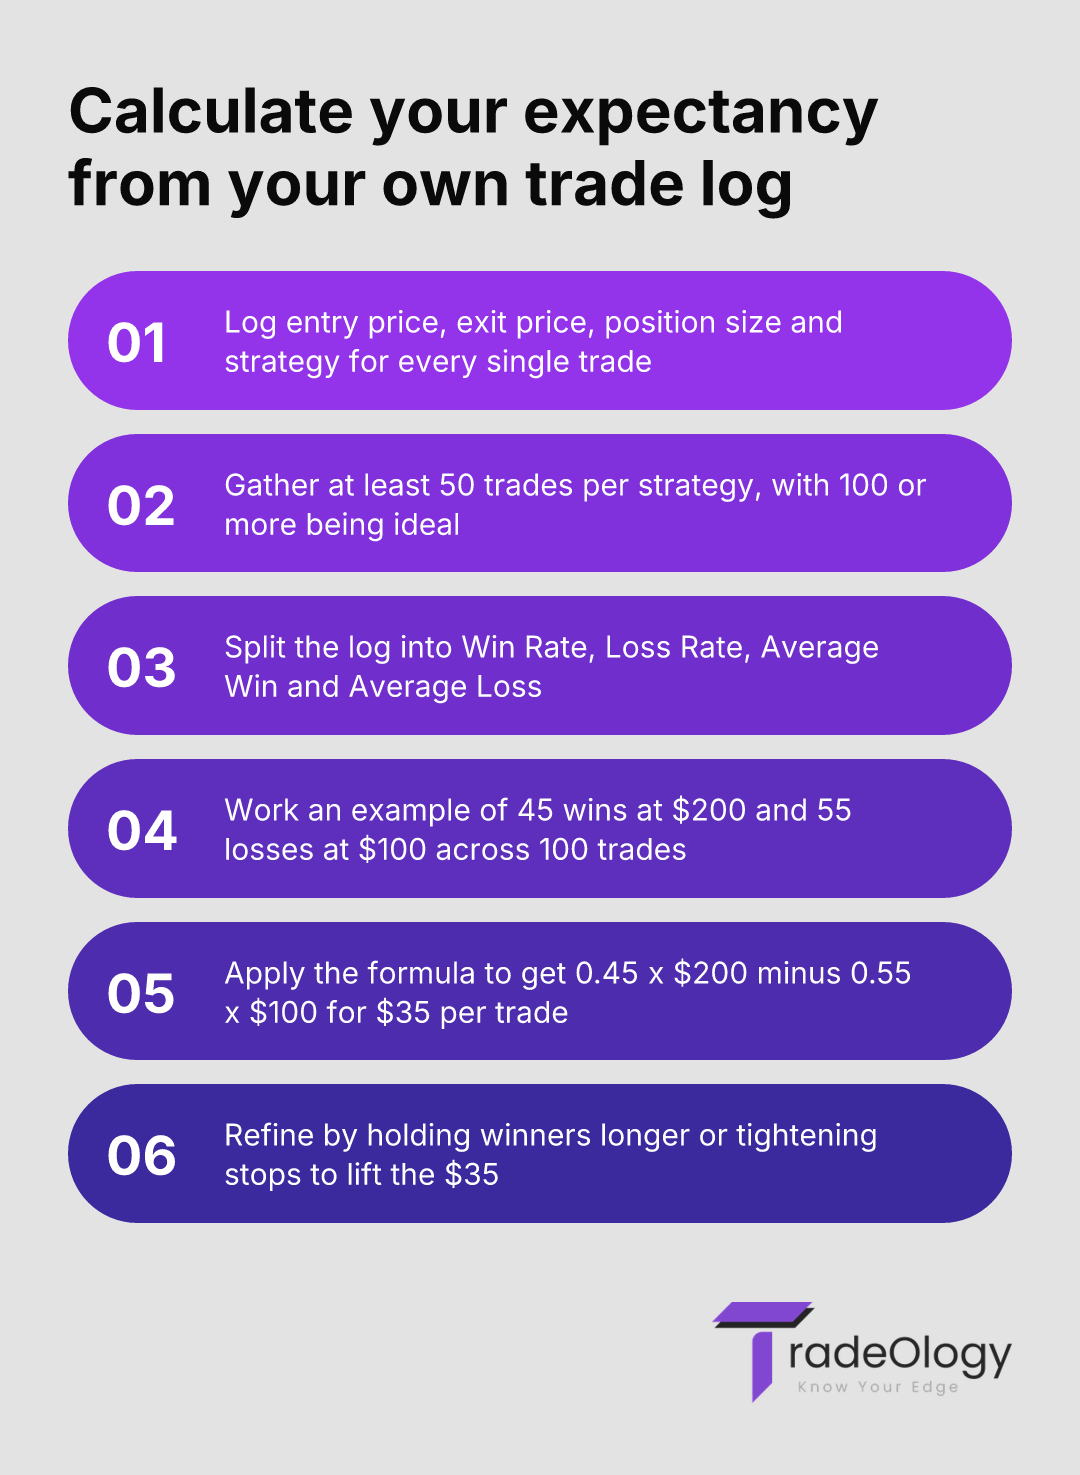
Log Every Trade with Precision: This is non-negotiable. For expectancy calculations to be valid, you need clean data. For every trade, you must record your entry price, exit price, position size, and the reason for the trade (the strategy). Without a detailed log, any calculation is just a guess. This is where using a trading journal becomes essential.
Gather a Statistically Relevant Sample Size: Your expectancy calculation after 10 trades is interesting but not statistically reliable. You need a larger sample of trades for your data to converge toward its true average. Aim for at least 50 trades, but 100 or more per specific strategy is ideal. This ensures a few random outlier trades don't skew the entire data set.
Calculate the Four Core Metrics: After you have a sufficient number of trades logged, calculate your Win Rate, Loss Rate, Average Win Size, and Average Loss Size. Let's say you've logged 100 trades:
You won 45 trades and lost 55 trades. Your Win Rate is 45% and Loss Rate is 55%.
The total profit from your 45 winning trades is $9,000. Your Average Win is $9,000 / 45 = $200.
The total loss from your 55 losing trades is $5,500. Your Average Loss is $5,500 / 55 = $100.
Calculate Your Trading Expectancy: Now, plug those numbers into the formula:
(0.45 x $200) – (0.55 x $100) = $90 – $55 = $35
This result means that for every trade you take with this system, you can statistically expect to make $35 over the long run. You now have a quantified trading edge.Analyze and Refine: A positive expectancy of $35 is great, but the work isn't done. How can you improve it? Look at your data. Perhaps you can increase your average win by holding profitable trades longer. Or maybe you can cut your average loss by tightening your stop-losses. This data-driven approach is how you properly evaluate and refine a trading strategy.
Real Trading Example: Putting Expectancy to Work
Let's walk through a realistic scenario for a swing trader with a $50,000 account. This trader uses a "break-and-retest" strategy on large-cap stocks. Their risk management rule is to risk no more than 1% of their account on any single trade, which is $500. They identify a setup in NVIDIA (NVDA). The stock has broken above a key resistance level at $900 and is now retesting it from above, showing signs of holding as support. The trader decides to go long.
Entry: $905
Stop Loss: $895 (a $10 stop distance)
Profit Target: $935 (a $30 profit target, aiming for a 3:1 R:R)
To risk $500 with a $10 stop distance, the position size is $500 / $10 = 50 shares. After a few days, the trade hits the profit target at $935. The profit is 50 shares * $30 = $1,500. Over the last six months, they have taken 60 trades using this exact setup. Their journal shows 24 winners and 36 losers (a 40% win rate). The average winning trade was around $1,500, and the average losing trade was always kept to the predefined $500 risk. Let's calculate the trading expectancy:
Win Rate: 40% (0.40)
Average Win: $1,500
Loss Rate: 60% (0.60)
Average Loss: $500
Expectancy = (0.40 x $1500) - (0.60 x $500) = $600 - $300 = $300 per trade. This shows a very healthy, positive expectancy. Despite losing more trades than they win, the system is highly profitable over time. This is the power of a disciplined approach to risk-reward and data tracking.
Common Mistakes When Dealing with Trading Expectancy
Many traders hear about expectancy but fail to apply it correctly. Avoiding these common mistakes is crucial for building a truly profitable trading system.
Ignoring Trading Costs: A calculated expectancy of $10 per trade might seem decent, but if your commissions, fees, and slippage average $12 per trade, you actually have a negative expectancy system. Always subtract your average cost per trade from your final expectancy number for a true picture of profitability.
Using an Insufficient Sample Size: Calculating your expectancy based on your last five trades is meaningless. A short-term winning or losing streak will completely distort the data. You need a large enough number of trades for the law of large numbers to smooth out random fluctuations.
Failing to Segment by Strategy: Lumping all your trades—scalps, swing trades, trend-following, and mean reversion—into one giant calculation will give you a useless, blended number. You must calculate a separate trading expectancy for each unique strategy to know what works and what doesn't.
Assuming Expectancy is Static: Market conditions change. A strategy that had a high positive expectancy in a strong bull market might perform poorly in a choppy, sideways market. You must periodically review and recalculate. Mastering the trade review process is key to staying adaptive.
Emotionally Overriding the System: Having a system with a positive expectancy is worthless if you don't follow it. If you take unplanned trades, chase losses, or fail to take valid setups because of fear, your actual results will never match your system's statistical edge.
How TradeOlogy Helps You Find Your Edge
Calculating your trading expectancy manually is possible, but it's tedious, time-consuming, and prone to human error. Did you remember to include commissions? Did you miscalculate your average win? This is where a dedicated analytics platform like TradeOlogy provides a massive advantage.
By simply logging your trades, TradeOlogy automatically does the heavy lifting. It instantly calculates your trading expectancy for every strategy, every timeframe, and every instrument you trade. The platform visualizes your key performance metrics, allowing you to see with a glance which setups have a real, data-backed edge.
Instead of spending hours in spreadsheets, you can immediately identify your most profitable patterns and understand the true drivers of your P&L. For example, our analytics might reveal that your long setups on Tuesdays have a +$75 expectancy, while your short setups on Fridays have a -$40 expectancy. This is the kind of actionable insight that allows you to focus your capital on what works and eliminate what doesn’t, systematically improving your performance over time. Without a robust journal and analytics tool, you are flying blind. Most traders fail for this very reason.
Frequently Asked Questions (FAQ)
How many trades do I need to accurately calculate my trading expectancy?
While there's no magic number, most statisticians would agree that a sample size below 30 trades is too small to be reliable. A good starting point is 50 trades per specific strategy, with 100 or more being ideal. The more trades you include, the more likely the calculated expectancy is to reflect the true, long-term performance of the system. A smaller data set can be easily skewed by a few lucky wins or unfortunate losses, giving you a false sense of confidence or despair.
What’s more important: a high win rate or a high risk-to-reward ratio?
Neither is more important in isolation; it's the balance between them that determines your trading expectancy. A system with a 90% win rate and a 1:10 R:R is a losing system. A system with a 20% win rate and a 10:1 R:R is a profitable system. The goal isn't to maximize one metric but to find a combination of win rate and R:R that produces a positive outcome. Some traders are psychologically better suited to high-win-rate/low-R:R systems, while others prefer low-win-rate/high-R:R trend-following systems. Both can be profitable if they have a positive expectancy.
My trading expectancy is negative. What should I do?
A negative expectancy is not a failure; it's valuable data. It tells you that your current approach is not viable and needs to change. First, use your trade journal to diagnose the problem. Are your losses too big? Your stop-loss discipline might be weak. Are your wins too small? You might be cutting winners short out of fear. A negative expectancy is your cue to go back and analyze your strategy, your risk management, and your execution. Start by focusing on one variable: try to increase your average R:R or see if you can be more selective with your entries to improve the win rate.
How often should I recalculate my trading expectancy?
You should review your performance metrics on a regular basis, such as weekly or monthly. However, you should only recalculate your core trading expectancy after a new batch of trades, for example, after every 20-30 new trades for a given strategy. This provides a rolling average and helps you monitor if your edge is degrading due to changing market conditions. The key is consistency. Tracking your performance, like through effective strategy performance tracking, allows you to adapt before a small drawdown turns into a major one, ensuring long-term survival and profitability.
Conclusion: Your Profitability is a Mathematical Equation
Moving from inconsistent results to consistent profitability requires a mental shift. You must stop chasing the emotional high of individual wins and start thinking like a casino operator. A casino doesn’t know whether the next spin of the roulette wheel will be a winner or a loser, and it doesn’t care. It cares that over thousands of spins, its small statistical edge guarantees profitability. Your trading expectancy is your personal statistical edge over the market. By capturing pristine data, calculating your expectancy for every strategy you trade, and systematically working to improve it, you move from gambling to professional risk-taking. This focus on the mathematical reality of your performance, not your feelings, is the foundation of every successful trading career and is the ultimate key to defining your long-term profitability.