

You followed your rules perfectly. You identified a clean A+ setup on the EUR/USD 15-minute chart, waited for a confirmation candle, and entered with your standard 2% risk. The trade moved in your favor for a bit, then reversed and hit your stop loss. It was the fifth losing trade in a row. Now, doubt creeps in. Is this just a normal drawdown, or is the strategy itself flawed? Every trader faces this question. The only way to find a real answer is to systematically evaluate trading strategy performance with objective data, not emotion. Without a clear framework for analysis, you’re just gambling — hoping the next trade is "the one" that makes it all back. But hope isn’t a strategy. Let’s break down how to move from hoping to knowing.
The Expectancy Formula
Strategy Expectancy = (Win Rate x Average Win) – (Loss Rate x Average Loss)
For example, if you win 40% of your trades, your average winning trade is $300, and your average losing trade is $150, the calculation is: (0.40 x $300) - (0.60 x $150) = $120 - $90 = $30. This means that for every trade you take, you can expect to make an average of $30.
The Problem: Relying on Gut Feel and Win Rate
Too many traders judge their strategies based on the outcome of the last few trades. A string of winners brings euphoria and confidence; a series of losses brings despair and the urge to scrap the system entirely. This emotional rollercoaster is a direct result of not having a systematic way to evaluate trading strategy performance. The most common trap is focusing solely on win rate. A trader might see a system online that boasts an 80% win rate and jump in, only to find that the few losses are so large they wipe out all the small wins, and then some.
Imagine a scalping strategy where you aim for 5 pips of profit but have a 25-pip stop loss. You might win 8 out of 10 trades, but that one losing trade erases four of your winners. This is negative strategy expectancy in action. Traders also struggle with small sample sizes. They test a strategy for 20 trades, see poor results, and abandon it. In reality, any professional system needs to be evaluated over hundreds of trades to determine its true edge. Without enough data, you can’t distinguish between random luck and a genuine statistical advantage.
How to Truly Evaluate Trading Strategy Performance
A successful trading strategy is simply a statistical edge executed with discipline over a large number of trades. To evaluate trading strategy effectiveness, you must look beyond short-term results and focus on key performance indicators (KPIs) that reveal your system’s underlying profitability. The most important metric is expectancy, which tells you what you can expect to make or lose on average, per trade. A positive expectancy means your system has a verifiable edge.
To calculate this, you need four pieces of data from your trading journal:
Total number of trades
Number of winning trades
Number of losing trades
Total profit from winners and total loss from losers
From these, you can derive your win rate, loss rate, average win size, and average loss size. Another powerful metric is the Profit Factor (Gross Profit / Gross Loss). A profit factor of 2.0 means you make $2 for every $1 you lose. Most professional traders look for a profit factor of 1.5 or higher. This kind of trading edge analysis forces you to be honest about whether your rules generate real profits over time, removing emotion and guesswork from the equation.
A Practical Framework for Strategy Evaluation
Here is a step-by-step framework to test and validate your trading ideas before risking significant capital.
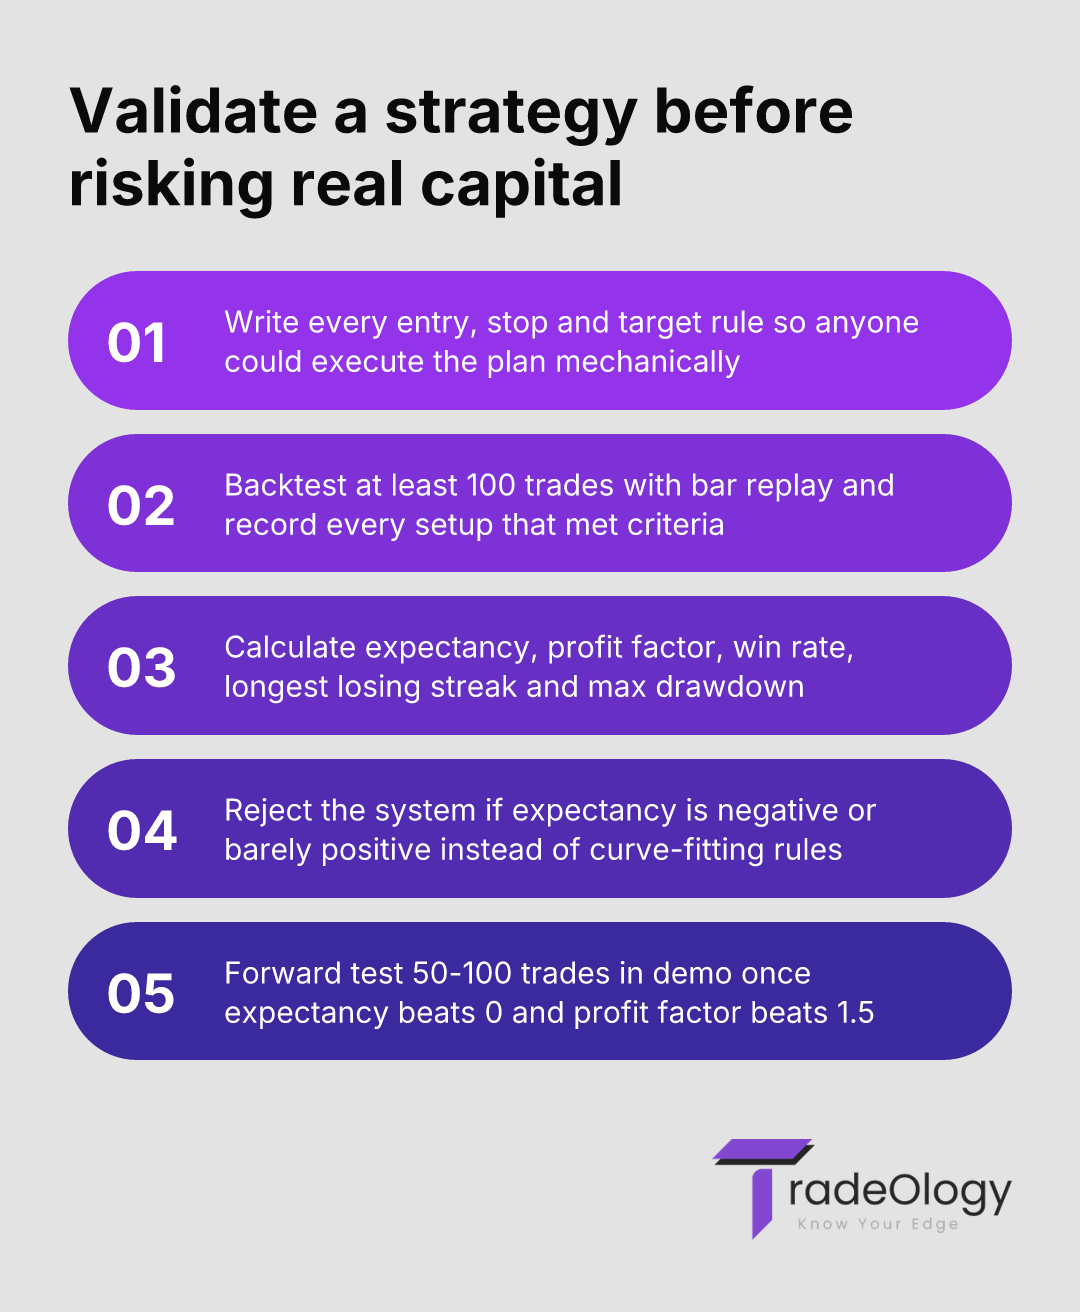
Define Every Rule in Advance
Before you run any tests, write down your strategy rules in painstaking detail. What are your exact entry criteria? What constitutes a valid setup? Where does your stop loss go? What are your profit-taking rules (e.g., fixed R:R, trailing stop, targeting a key level)? What markets and timeframes will you trade? Vague rules lead to inconsistent execution and meaningless data. Your goal is to create a mechanical system that anyone could execute just by reading your plan.
Historical Backtesting (Minimum 100 Trades)
Go back in time on your charts and manually simulate at least 100 trades based on your defined rules. This is not about cherry-picking winning setups. Be brutally honest. If a setup meets your criteria, you take the trade in your simulation. Record the outcome, potential profit/loss, and R:R for every single one. This is a crucial part of system performance trading analysis. Many traders use tools like TradingView's "Bar Replay" feature to move forward one candle at a time, which helps avoid hindsight bias.
Analyze the Backtesting Data
With your 100+ simulated trades, calculate your core metrics: expectancy, profit factor, win rate, and average R:R. What was the longest losing streak? What was the maximum drawdown (peak-to-trough decline in equity)? If the expectancy is negative or barely positive, the strategy is not viable as-is. You may need to tweak your risk management rules (e.g., improve your R:R) or your entry criteria. But remember not to "curve-fit" your rules to produce a perfect backtest — this will fail in live markets.
Forward Testing in a Demo Account
If the backtesting results are promising (e.g., expectancy > 0 and profit factor > 1.5), it’s time for forward testing. Trade the strategy in a demo account for another 50-100 trades. This tests how the strategy performs in current market conditions and, just as importantly, how well you execute it under pressure. Can you follow the rules when the market is moving and no one is watching? This step often reveals psychological hurdles that backtesting misses.
Real Trading Example: Evaluating a Break-and-Retest Strategy
Let's walk through how a trader with a $10,000 account might evaluate trading strategy performance for a classic break-and-retest setup on the NASDAQ 100.
Account Size: $10,000
Risk Per Trade: 1% ($100)
Strategy: Buy the retest of a broken resistance level on the 1-hour chart, placing the stop loss 10 points below the retest candle's low.
Profit Target: Aim for a 2:1 Risk/Reward Ratio.
The trader backtests this strategy over 120 historical setups. The data shows 48 winners and 72 losers. The win rate is 40% (48/120). Each winning trade made $200 (2R), and each losing trade lost $100 (1R). Let's calculate the expectancy:
Expectancy = (0.40 * $200) - (0.60 * $100) = $80 - $60 = $20 per trade.
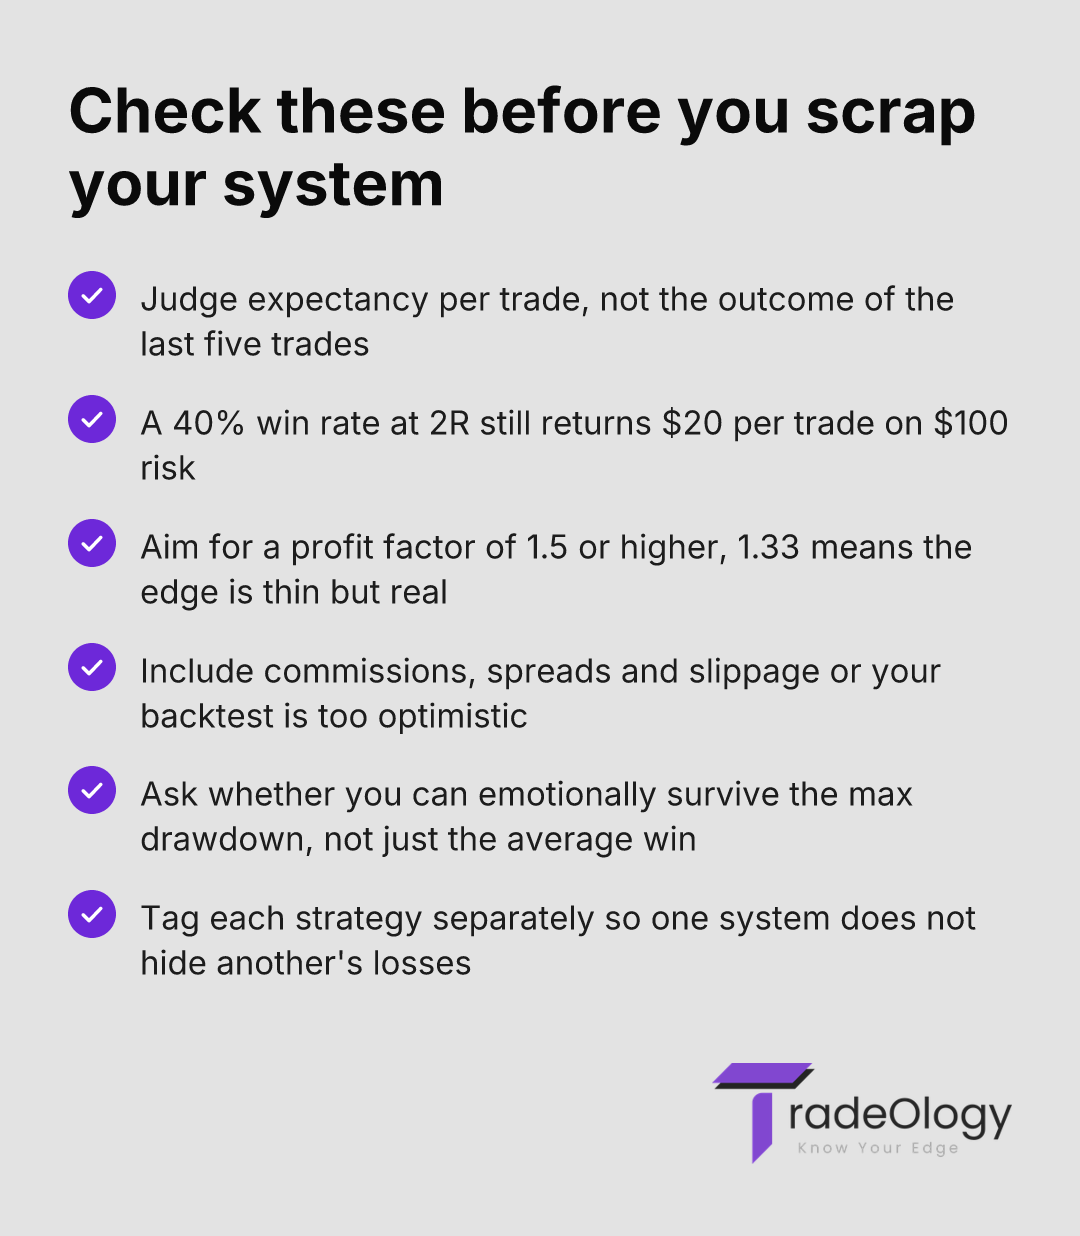
A $20 positive expectancy per trade is a solid edge. The Profit Factor is ($200 * 48) / ($100 * 72) = $9,600 / $7,200 = 1.33. While the trader might prefer a higher profit factor closer to 1.5, the positive expectancy confirms the strategy has merit. The next step is forward testing this system in a demo account to validate the results in a live environment.
Common Mistakes in Strategy Evaluation
Giving Up After a Losing Streak: Every profitable strategy has drawdowns. Quitting after 5 or 10 losses means you never give the system’s statistical edge a chance to play out. You need a large sample size of trades to properly evaluate trading strategy results.
Curve-Fitting: This involves excessively tweaking rules to perfectly match past data. A strategy optimized to perfection on historical charts is often too rigid to adapt to live, dynamic markets. It looks great in the rearview mirror but fails in real-time.
Ignoring Risk and Drawdown: A strategy might have a positive expectancy, but if its maximum drawdown is 50%, can you emotionally handle losing half your account? Evaluating potential drawdowns is a critical part of determining if a strategy fits your personal risk tolerance.
Not Accounting for Trading Costs: Commissions, spreads, and slippage are real costs that eat into profits. Backtesting that ignores these costs will present an overly optimistic picture. Always include estimated costs in your trading edge analysis. For more on this, see this breakdown of transaction costs.
Inconsistent Execution: If you constantly override your strategy's rules based on fear or greed, you aren't actually testing the strategy. You are testing your own undisciplined decision-making. Consistent execution is mandatory for gathering reliable performance data.
How TradeOlogy Helps You Evaluate Your Trading Strategy
The entire process of strategy evaluation relies on one thing: high-quality data. This is where a dedicated trading journal like TradeOlogy becomes indispensable. Instead of scribbling notes in a messy spreadsheet, you can systematically log every trade with custom tags for setups, mistakes, and market conditions.
Imagine trying to calculate your expectancy or profit factor across 200 trades manually. It’s tedious and prone to errors. TradeOlogy automates this. Our analytics dashboard instantly shows you your key performance metrics, updated with every trade you log. You can filter your results to see exactly how your "Head and Shoulders" strategy performs on Tuesdays versus how your "Momentum Breakout" strategy does during the London session. This is the essence of effective strategy performance tracking.
By providing clear, visual data on what works and what doesn’t, TradeOlogy helps you move from guessing to knowing. It removes the emotion and provides the objective feedback needed to refine your edge. The trade review process changes from a frustrating chore into a powerful tool for improvement.
Frequently Asked Questions (FAQ)
1. How many trades does it take to know if a strategy works?
While there is no magic number, most professional traders agree that a sample size of at least 100 trades is necessary for a preliminary evaluation. A sample size smaller than this is highly susceptible to luck — both good and bad. To achieve a high degree of statistical confidence, 200-300+ trades are recommended. This ensures your performance metrics (like win rate and expectancy) are stable and not just a result of a random sequence of winners or losers. The goal is to trade enough so that your results approach their true statistical average.
2. My backtesting results are great, but I lose money in live trading. Why?
This is a very common problem that usually stems from two issues: psychology or hidden variables. Psychologically, it's easy to "take" every trade in a backtest with no emotional pressure. In live trading, fear of losing money can cause you to hesitate, miss entries, or cut winners short. Second, your backtesting might have missed hidden variables like slippage, commissions, or the impact of news events. This is why forward testing in a demo account is a critical bridge between historical data and live trading — it forces you to execute in real-time market conditions.
3. Can I use multiple strategies at once?
Yes, many experienced traders use a portfolio of strategies. However, it is crucial that you evaluate trading strategy performance for each one independently. If you lump all your trades together in your analysis, you won't know which system is contributing profits and which one is draining your account. Use your trading journal to tag each trade with the specific strategy used. This allows you to isolate and analyze each system’s expectancy, profit factor, and drawdown individually, ensuring each one has a proven edge.
4. What is a good profit factor for a trading strategy?
A profit factor above 1.0 indicates a profitable system (since gross profits exceed gross losses). However, most traders aim for a profit factor of 1.5 or higher. A strategy with a profit factor between 1.1 and 1.4 might be profitable, but its edge is small and could easily be eroded by a few unexpected losses or changes in market conditions. A system with a profit factor of 2.0 or more is considered very robust, as it indicates you are making $2 for every $1 risked. It provides a significant cushion to withstand inevitable drawdowns.
Conclusion
Ultimately, the ability to properly evaluate trading strategy performance is what separates disciplined, profitable traders from hobbyists. It’s about replacing emotional reactions with objective, data-driven analysis. Moving beyond simplistic metrics like win rate and embracing concepts like expectancy and profit factor is non-negotiable for long-term success. The best traders are not those who find a "perfect" system, but those who are masters of reviewing their own performance and making incremental improvements based on hard data. The only way to build unshakable confidence in your edge is to prove it to yourself with numbers. Your trading journal and analytics are the tools you use to do just that, allowing you to systematically evaluate trading strategy effectiveness and make decisions like a true professional.