

When it comes to strategy performance tracking, understanding the fundamentals is essential for any trader.
Why Effective Strategy Performance Tracking is Your True North
One good week doesn’t make you a market wizard. We’ve all been there: you string together a series of winning trades, your account equity spikes, and you feel invincible. You start taking bigger risks, convinced you’ve finally cracked the code. Then, in a few bad sessions, you give it all back—and then some. The confidence evaporates, replaced by frustration and doubt. This emotional rollercoaster is a hallmark of discretionary trading without data. The only way to break this cycle and build a sustainable career is through disciplined strategy performance tracking. It’s the unflinching, objective mirror that tells you what’s actually working, separating luck from repeatable skill. Without it, you’re just navigating the markets with a broken compass.
Quick Formula: Trading Expectancy
Expectancy = (Average Win Size × Win Rate) – (Average Loss Size × Loss Rate)
This formula reveals the average amount you can expect to win or lose per trade over the long run. For example, if you win 50% of your trades, with an average win of $400 and an average loss of $200, your expectancy is ($400 × 0.50) - ($200 × 0.50) = $100 per trade. A positive expectancy is the statistical foundation of a profitable trading system.
The Problem: Flying Blind in a Data-Driven Arena
Most struggling traders operate on gut-feel and recency bias. If their last few trades were winners, their strategy feels brilliant. If they hit a losing streak, they assume the strategy is broken and immediately start tweaking variables or jumping to a completely new system. This reactive approach is a recipe for disaster. Without objective data, you can’t distinguish between a good strategy experiencing a normal drawdown and a fundamentally flawed one.
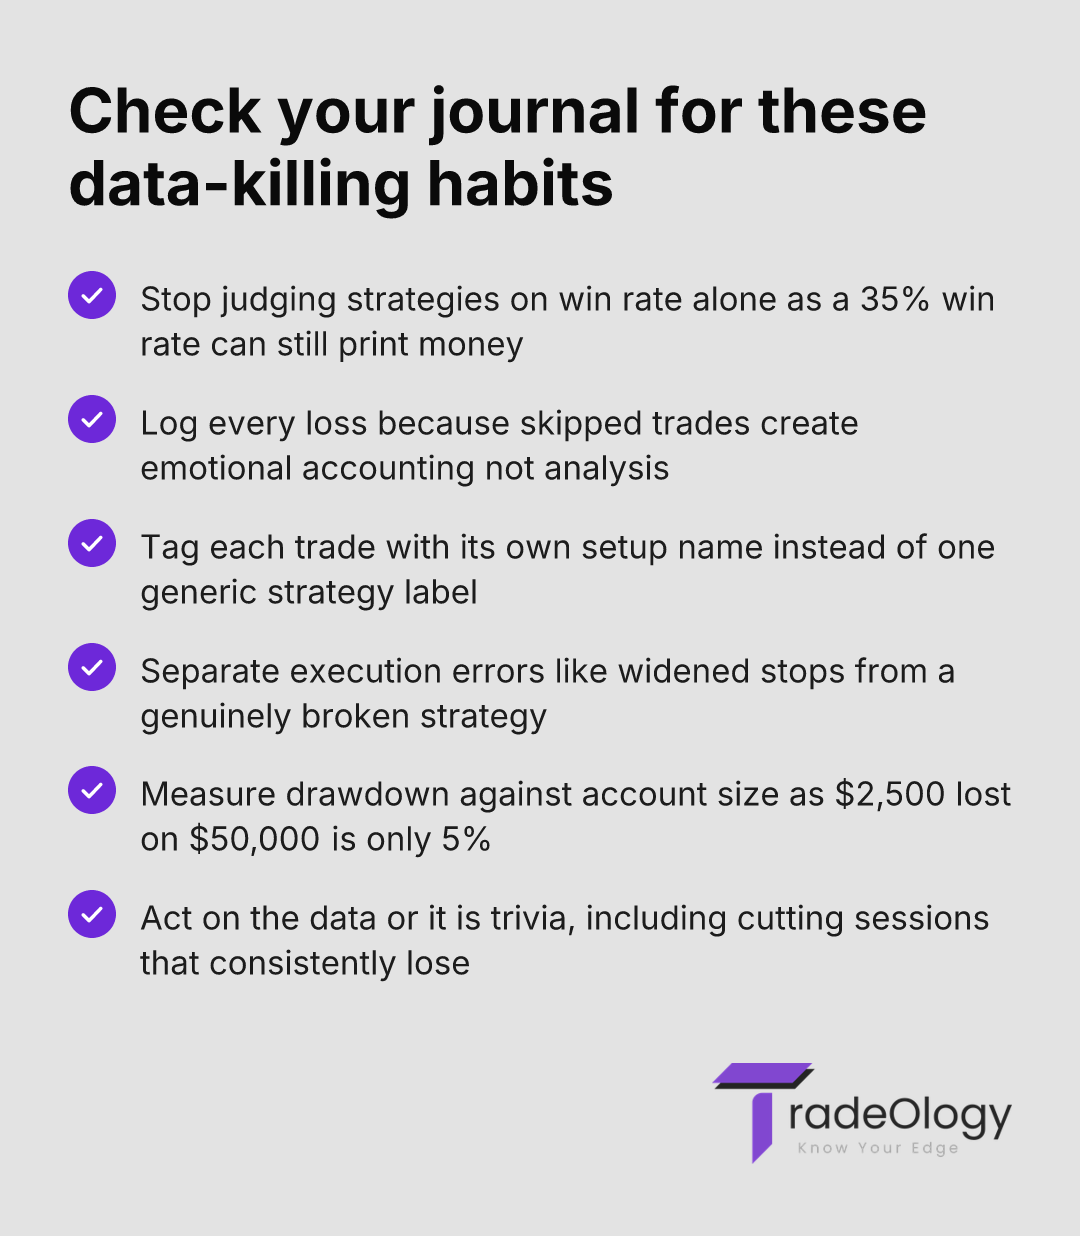
Consider a trader risking $500 per trade on a system that, historically, has a 20% max drawdown. After five consecutive losses ($2,500 drawdown), they panic and abandon the strategy, convinced it no longer works. However, if their account size is $50,000, this is only a 5% drawdown—well within the strategy’s normal statistical behavior. A lack of proper strategy performance tracking caused them to discard a potentially profitable system right before its next winning streak. This is a classic, and costly, mistake that robust trading system evaluation prevents.
Understanding True Trading Performance
Effective strategy performance tracking goes far beyond looking at your account balance. It’s the systematic process of recording specific data points for every trade to evaluate a strategy’s effectiveness against a set of key performance indicators (KPIs). It’s about building a database of your own performance so you can make decisions based on statistical evidence, not emotion. Think of yourself as a scientist running experiments; each trade is a data point.
The core metrics you track provide a multi-dimensional view of your edge. While P&L is the ultimate outcome, it doesn’t tell you how you got there. That’s where metrics like Expectancy, Profit Factor, and Sharpe Ratio come in. Expectancy tells you what a trade is worth on average. Profit Factor (Gross Profit / Gross Loss) measures the size of your wins in relation to your losses. A Profit Factor of 2.0 means you make $2 for every $1 you lose. The Sharpe Ratio measures your return per unit of risk, factoring in volatility. These are the building blocks of professional trading system evaluation.
A Practical Framework for Strategy Performance Tracking
Implementing a robust tracking system is the single most impactful step you can take to improve your results. It turns trading from a gamble into a business. Here is a step-by-step framework to get started.
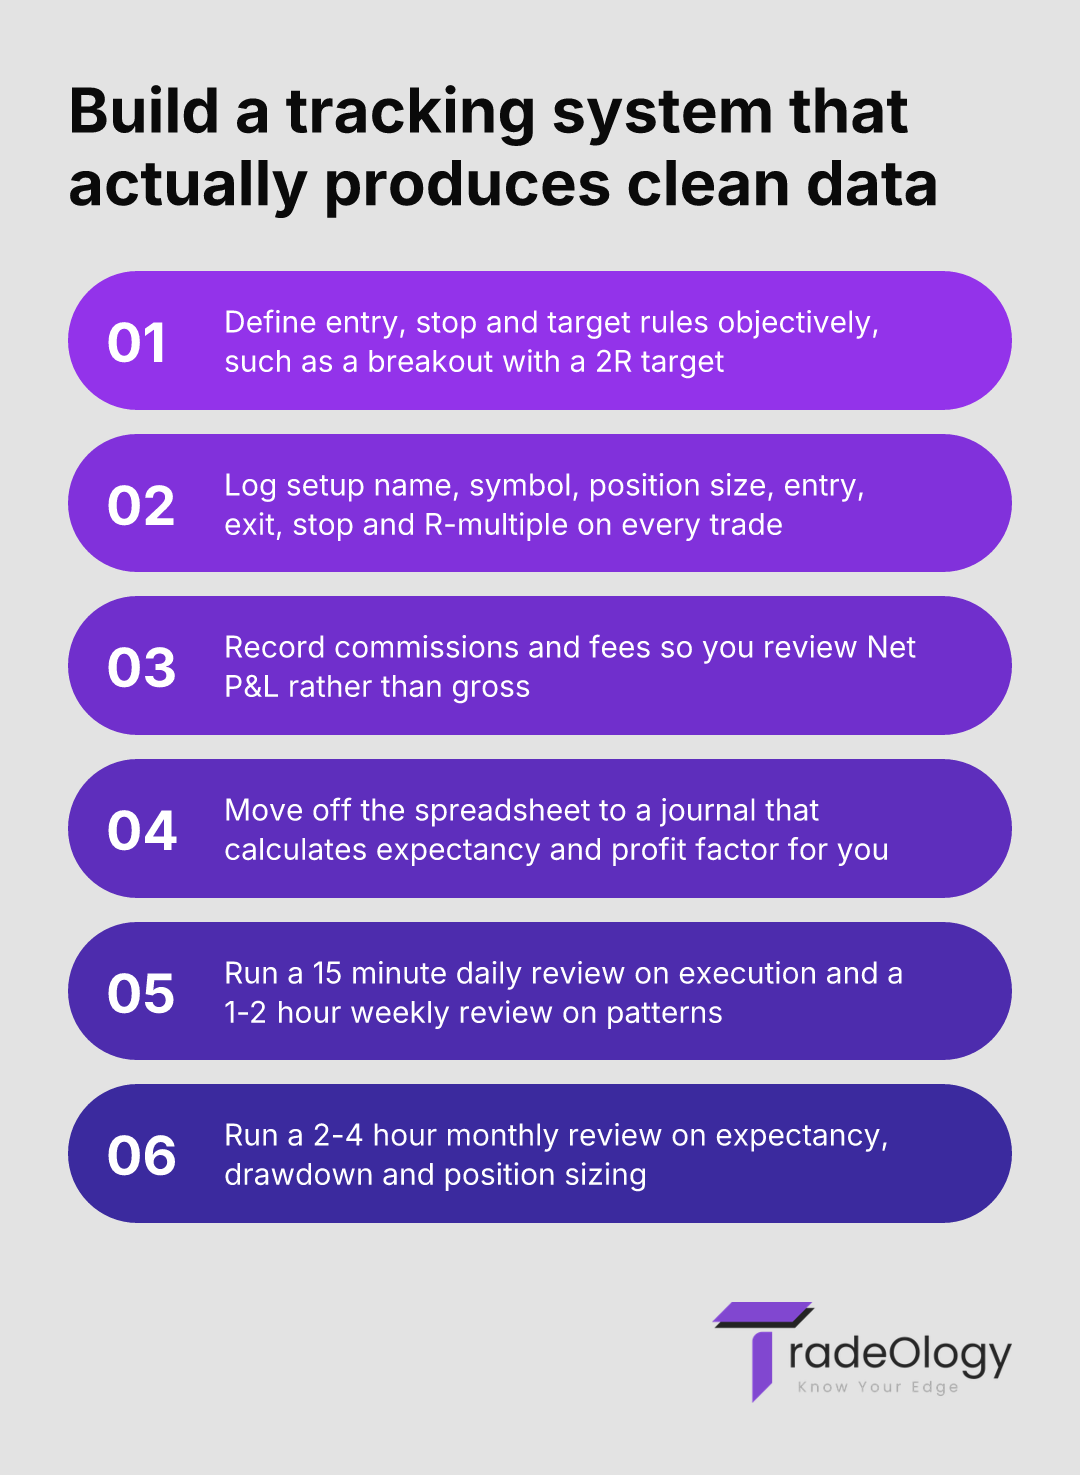
Define and Standardize Your Strategy Rules: Before you can track a strategy, you must define it with unwavering clarity. What specific, objective conditions must be met for a trade to be valid? This includes entry signals, exit rules (for both profit targets and stop losses), and risk management parameters. For example, a "Breakout" strategy might be defined as: "Entry on the first 5-minute candle to close above the prior day's high, with a stop loss below the low of the breakout candle and a profit target at 2R." Without this objectivity, your data will be noisy and unreliable.
Select Your Key Performance Indicators (KPIs): You can’t improve what you don’t measure. For each trade, you need to log a consistent set of data points. Start with these essential fields:
Setup/Strategy Name: (e.g., "Mean Reversion," "Momentum Flag")
Date and Time: To analyze performance by session or day.
Symbol: Which asset you traded.
Position Size: How many shares or contracts.
Entry and Exit Prices: The raw data for P&L calculation.
Stop Loss Level: Your initial planned risk.
R-Multiple: The final profit or loss expressed as a multiple of your initial risk.
Commissions & Fees: To calculate your Net P&L.
Screenshots: A visual record of the setup at entry and exit.
Choose Your Journaling Tool: A simple spreadsheet can work initially, but it quickly becomes cumbersome. A dedicated trading journal like TradeOlogy is built specifically for this purpose, automating many of these KPIs and providing powerful trading strategy analytics. The goal is to make data logging as frictionless as possible so you can focus on trading and review.
Schedule and Execute Regular Reviews: Data collection is useless without analysis. You must build a review process into your routine. A great framework is the three-tiered review:
Daily Review (15 mins): Focus on execution. Did you follow your plan on every trade today? Note any mistakes like chasing entries or moving stops.
Weekly Review (1-2 hours): Focus on patterns. Sort your trades by strategy, day of the week, or R-multiple. Are certain setups outperforming others? Are you consistently making the same execution errors?
Monthly Review (2-4 hours): Focus on the big picture. Is your strategy’s expectancy still positive? How is your drawdown? Is it time to adjust position sizing or retire an underperforming strategy?
Real Trading Example: Putting Tracking into Practice
Let’s walk through a scenario. A trader named Sarah has a $50,000 account and a "Support Bounce" strategy she trades on QQQ. Her risk is fixed at 0.5% of her account per trade, which is $250.
A setup forms as QQQ pulls back to a known daily support level at $430. Sarah enters a long position at $430.50. Her plan is to place her stop loss below the support level, at $429.50. The distance is $1 per share.
Position Size Calculation: Risk per Trade / Stop Distance = $250 / $1.00 = 250 shares.
Trade Management: The trade moves in her favor. She sells half her position (125 shares) at $432.50 for a $2 profit per share (a 2R gain on that portion) and moves her stop on the remaining shares to her entry price.
Exit: The rest of the position stops out at breakeven.
In her journal, she logs this as a "Support Bounce" trade. The net result is a $250 profit, or 1R. By logging this consistently, she can compare the profitability of this setup against her other strategies. After 50 trades, she might find her "Support Bounce" strategy has a positive expectancy of 0.8R, while her "Breakout" strategy is at -0.2R. This is actionable intelligence that only disciplined strategy performance tracking can provide.
Common Mistakes in Strategy Performance Tracking
Many traders attempt to track performance but fall into common traps that invalidate their efforts. Avoiding these is critical for generating reliable data.
Focusing Only on Win Rate: This is the most common mistake. A high win rate feels good, but it's a vanity metric without context. A strategy that wins 90% of the time but loses big on the 10% can be a net loser. Conversely, a trend-following system might only win 35% of the time, but if the average winner is 5x the average loser, it can be incredibly profitable. This is why expectancy is a far more important metric.
Inconsistent Data Logging: Forgetting to log trades, especially losses, creates a skewed and overly optimistic view of your performance. Your data is only as good as its integrity. If you only log the trades that make you feel good, you are performing "emotional accounting," not objective analysis.
Mixing Different Strategies: If you trade three different setups but log them all under one generic "strategy," your data isn't clean. You can't know which setup is responsible for the profits or losses. Effective strategy metrics trading requires tagging every trade with a specific, predefined setup name.
Confusing Bad Execution with a Bad Strategy: Your strategy might be sound, but your execution could be flawed. Were you hesitating on entries, widening your stops mid-trade, or taking profits too early? You must tag these execution errors in your journal. Often, the path to profitability isn’t a new strategy, but simply executing your current one flawlessly.
Not Acting on the Data: The final mistake is collecting all this data and then letting it sit there. The purpose of trading strategy analytics is to drive decisions. If the data shows your performance is significantly worse on Fridays, the solution is to analyze why or consider not trading on Fridays. Data without action is just trivia.
How TradeOlogy Elevates Strategy Performance Tracking
While a spreadsheet is a start, a professional analytics platform like TradeOlogy is designed to solve the core challenges of strategy performance tracking. The goal is to remove friction from the process so you can focus on analysis. Instead of manually calculating your R-multiple, profit factor, or expectancy after every trade, TradeOlogy does it for you. By connecting to your broker, it can import trade data automatically, eliminating the risk of inconsistent or emotional data logging.
The true power lies in the analytics dashboard. With a few clicks, you can filter your entire trade history by a specific setup. The platform instantly generates a report card for that strategy, showing you all the vital strategy metrics trading professionals use: expectancy, win rate, average R:R, max drawdown, and more. You can visualize your equity curve for just that system, helping you determine if a recent losing streak is just noise or a signal that the strategy’s edge is fading. This level of insight is nearly impossible to achieve with a manual spreadsheet and is fundamental to serious trading system evaluation.
Frequently Asked Questions (FAQ)
How many trades do I need to track to know if a strategy is viable?
There’s no magic number, but you’re looking for a statistically relevant sample size. A common rule of thumb is to have at least 30-50 trades for an initial assessment. However, to have high confidence in metrics like expectancy and drawdown, a sample of 100+ trades is far more reliable. The key is to trade a consistent position size during this evaluation period to ensure the data is not skewed by a few outlier trades with large risk.
Is it possible to track performance for a discretionary trading strategy?
Absolutely. While discretionary trading isn’t fully mechanical, it is still based on recognizable patterns and rules. The key is to create standardized tags for your setups. For instance, even if your entry isn't based on a rigid formula, you can tag the trade’s context, such as "Breakout-Retest," "Support Holding," or "Reversal at VWAP." This allows you to analyze your intuitive decisions and find where your discretionary edge truly lies. Many discretionary traders find they are elite at one or two specific patterns and mediocre at others.
What is the difference between Profit Factor and Expectancy?
They are both crucial but measure different aspects of profitability. Profit Factor (Gross Profits / Gross Losses) tells you how many dollars you make for every dollar you lose. A Profit Factor of 2.5 is excellent. Expectancy, on the other hand, tells you the average P&L of each trade. It synthesizes win rate and R:R into one metric. A high Profit Factor confirms you have large wins relative to losses, while a positive Expectancy confirms the system is profitable overall on a per-trade basis.
What if my strategy performance tracking shows I'm losing money?
This is valuable information! A negative expectancy is a clear signal to stop trading that strategy with real money. Your data is now your guide. The first place to look is at execution errors. Are you following your rules? If your execution is perfect, then the strategy itself is flawed. Use your trading strategy analytics to diagnose the issue. Is the average loss too high? Is the win rate too low? This data allows you to go back to the drawing board with concrete evidence, not just a feeling of failure.
Conclusion: Stop Guessing, Start Measuring
In trading, you can either rely on hope and emotion, or you can operate like a professional with a data-driven feedback loop. The bridge between these two worlds is effective strategy performance tracking. It’s the only way to know with certainty if you have a genuine edge or if you’ve just been lucky. By meticulously logging your trades and analyzing the right metrics, you move beyond wins and losses and begin evaluating the system itself. This objective, analytical approach builds confidence, resilience, and, most importantly, consistency.
Ultimately, your success will not be defined by a single trade, but by your commitment to a process of continuous improvement. That process begins and ends with rigorous strategy performance tracking. Stop guessing if your strategy works—start tracking, and you’ll know.