

Day trading performance by session and hour is the breakdown of your closed round trips into clock buckets, premarket, regular hours, and each individual hour within them, so you can see which windows carry positive expectancy and which quietly drain the account. Small accounts almost never blow up in a single hour. They bleed out in one two-hour block that looks harmless because the win rate there is only slightly below average, and because the losses are small enough to feel like the cost of doing business. They are not. They are the whole business.
Why the leak gets blamed on the setup
A trader tags every entry, runs the report, and finds that VWAP reclaims are down $1,100 over the quarter. The obvious conclusion is that the setup stopped working, so the setup gets deleted. Three weeks later the account is worse, because that setup was printing money between 09:35 and 10:30 and losing all of it between noon and 13:30. The tag was never the variable. The clock was.
Two-bucket thinking makes this worse. "Morning" and "afternoon" hides at least four distinct regimes: the opening auction imbalance, the mid-morning trend leg, the lunch reversion, and the closing rebalance. Each has a different realised range, a different fill quality, and a different probability of a fixed-point target being reached. Averaging them produces a number that describes none of them.
Small accounts are structurally exposed to this. Under the FINRA pattern day trader rule, a margin equity account below $25,000 gets three day trades per five rolling business days, which pushes most undercapitalised traders into micro futures or crypto where no such cap exists. The cap disappears and the screen time does not, so exposure stretches across the entire session. The account then leaks by duration, not by size.
What actually matters: expectancy per hour, in R, net of fees
Here is the part almost nobody measures. The hour that destroys a small account is usually the hour immediately after the best hour, and the cause is a sizing mismatch rather than a setup failure.
Check it yourself. Pull your average position size by hour and put it next to the realised 5-minute range by hour. On the E-mini, the 5m ATR around 09:35 ET runs near 6.2 points; by 12:15 it is closer to 2.1. If your target is a fixed 8 points, that target sits at roughly 1.3x the prevailing range at the open and 3.8x at midday. Your stop stays perfectly reachable at both times. Win rate falls off a cliff, the average loss does not move, and expectancy flips negative while your size stays flat because you never told it to change.
That is a measurable, falsifiable claim about your own data. Plot win rate by hour against realised range by hour. If your exits are fixed in points, the two curves track each other almost linearly, and the divergence point is your leak. The same mechanic shows up across asset classes, which is why gold futures show an expectancy cliff between the London fade and the US open, and why crypto books tend to die in a specific UTC hour despite having no closing bell at all.
How to audit day trading performance by session and hour
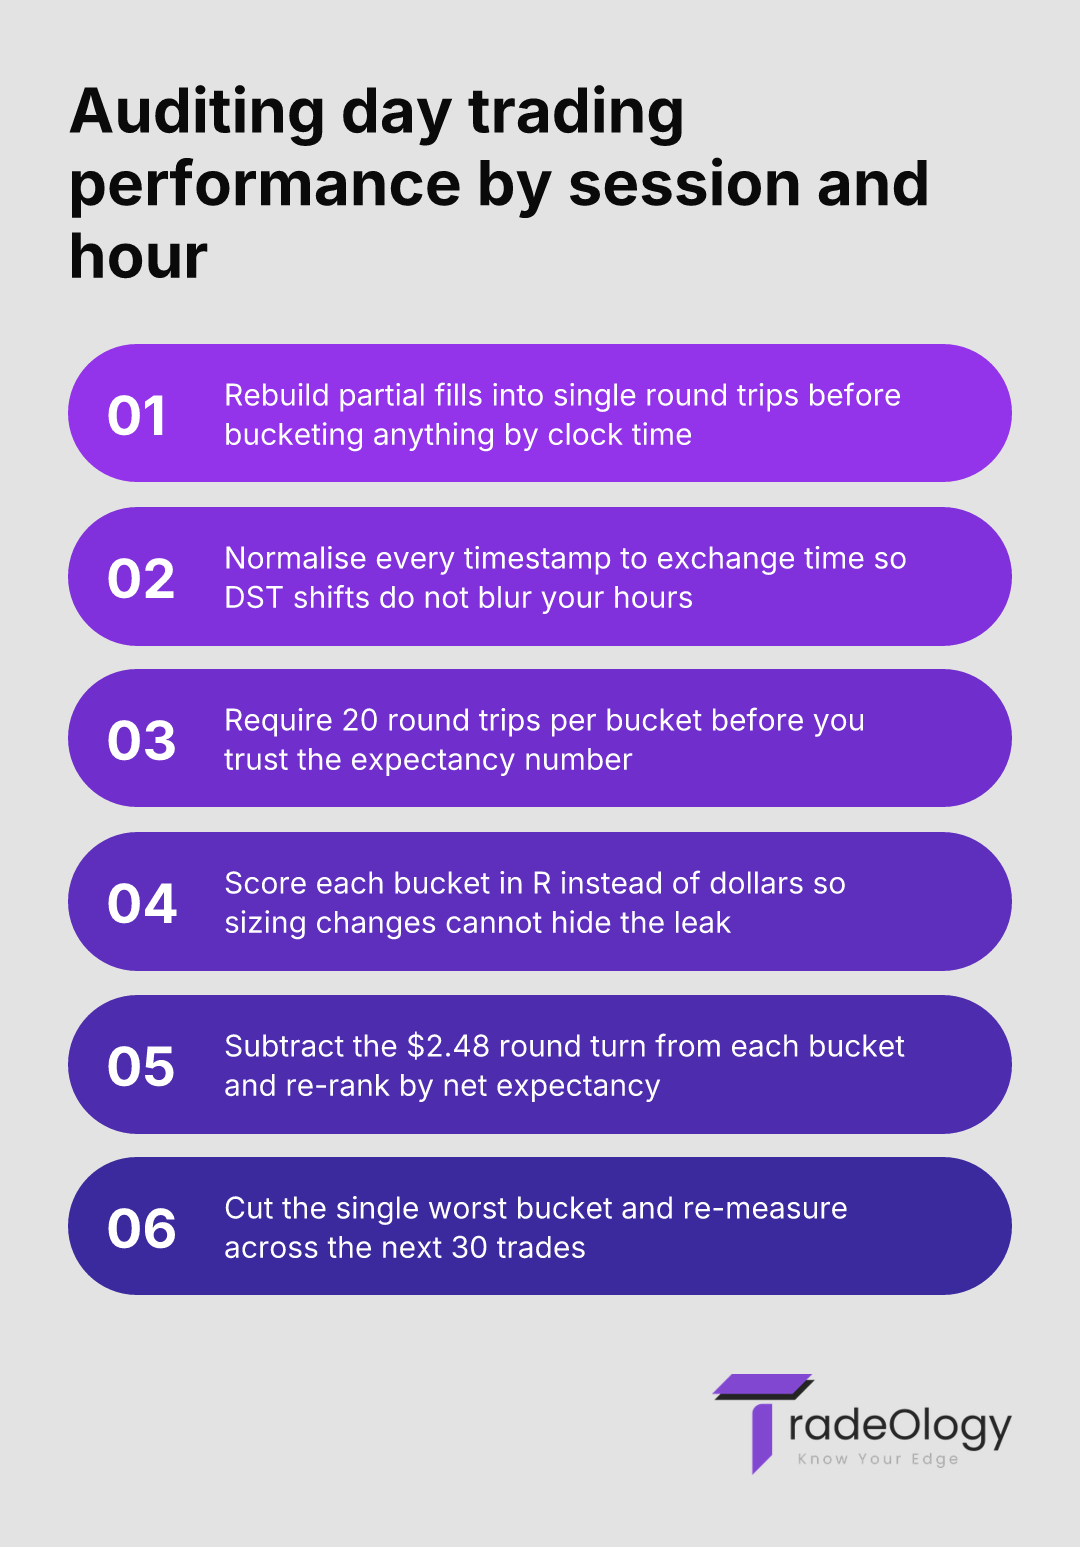
The audit fails before it starts if the data is wrong, so the first two steps are not optional.
Rebuild partial fills into single round trips, then stamp each one by entry time, not exit time.
Normalise every timestamp to exchange time so a broker CSV in local time does not smear March and November trades across the wrong hour.
Filter out any bucket with fewer than 20 round trips before drawing a conclusion, because a 12-trade hour is standard error, not signal.
Calculate expectancy in R per bucket rather than dollars, so a size increase cannot disguise a deteriorating edge.
Subtract commissions and fees inside each bucket, then re-rank the hours by net expectancy.
Rank the buckets, cut the worst one outright, and re-measure across the next 30 round trips. Do not cut two at once. If you remove three hours and the equity curve straightens, you have no idea which removal did the work.
Reading the numbers you get back
Metric | What it actually means | Action to take |
|---|---|---|
Win rate down 15 points in one hour, average loss unchanged | Your target is too wide for that hour's realised range. | Scale targets to the hour's ATR or stop trading the hour. |
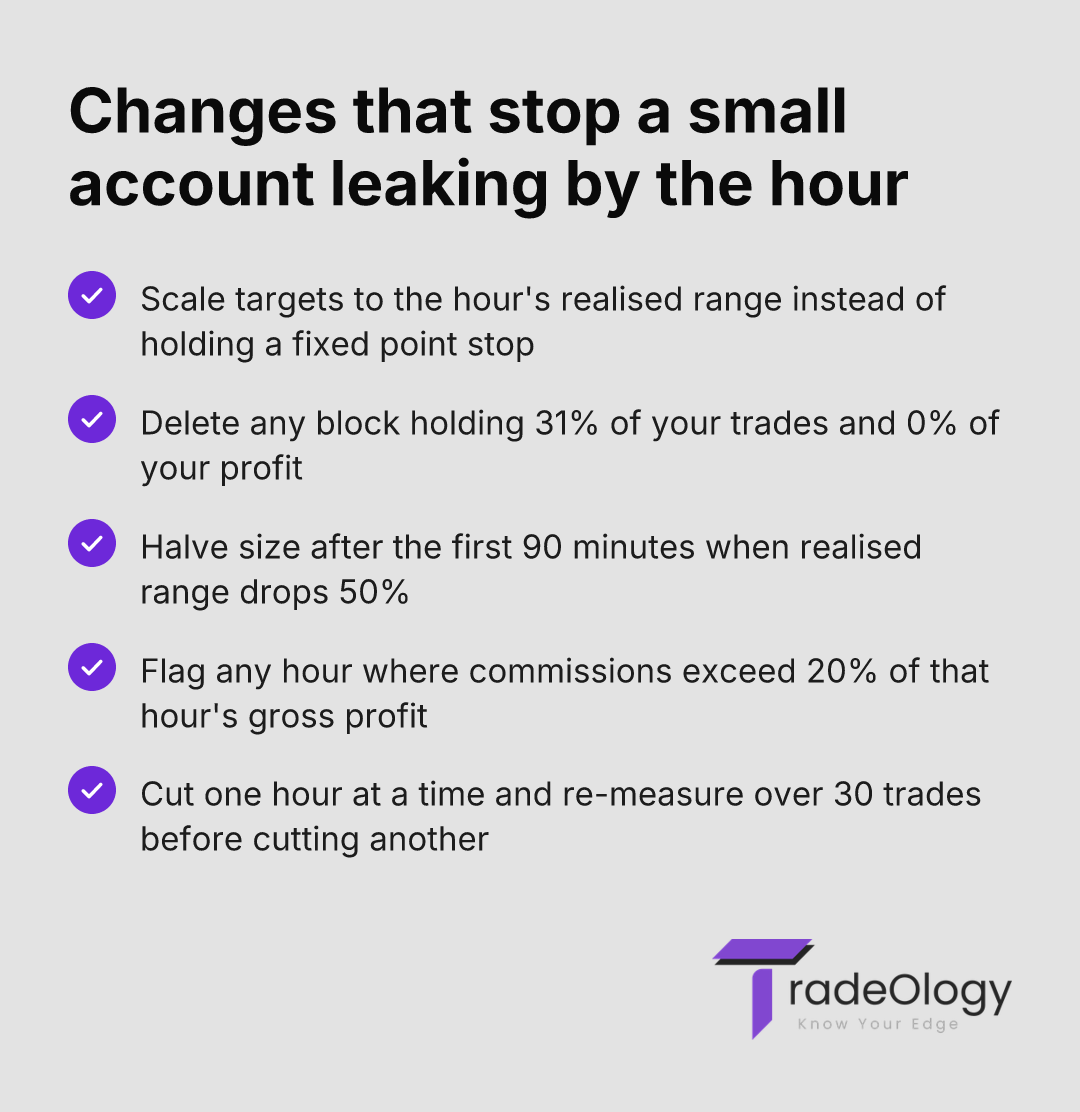
Commissions above 20% of gross profit in a bucket | That hour is a volume habit, not an edge. | Cap trade count per hour and re-measure over 30 trades. |
Profit factor above 1.5 but net expectancy near zero | Fees and slippage are eating an edge that exists gross. | Trade fewer, larger positions in the same window. |
Average size flat across hours, realised range down 50% | You are paying open-session risk for lunch-session movement. | Halve size after the first 90 minutes as a default rule. |
Deepest intraday drawdown clustered in one hour | Sequencing, not variance, is driving your equity dips. | Set a hard stop-trading time before that hour begins. |
A $7,500 account, 386 round trips, one quarter
MES trader, $7,500 starting equity, average two contracts, 62 sessions, 386 round trips. Round-turn commission of $1.24 per contract, so $2.48 per trade, or $957 across the quarter. Gross P&L was +$1,120. Net was +$163. Three months of screen time for 2.2% on the account.
The hourly split told the whole story. From 09:30 to 10:30: 96 trades, +$2,340 gross, expectancy +0.31R. From 10:30 to 11:30: 74 trades, +$410. From 11:30 to 13:30: 118 trades, -$1,190 gross, expectancy -0.22R. From 13:30 to 16:00: 98 trades, -$440.
The midday block held 31% of all trades and produced none of the profit, plus $293 of the commission bill. Removing it leaves 268 trades, +$2,310 gross, $665 of commissions, and $1,645 net. Same setups, same trader, same account. The only change is a clock rule. The win rate in that block was 31% against 47% at the open, and the average loss was identical in both windows, which is exactly the fingerprint of a fixed target meeting a compressed range.
If your average position size in the noon hour sits within 10% of your 09:30 hour while realised range is down 50%, that block is not a setup problem. You are funding open-session risk with lunch-session movement, and the arithmetic has already decided the outcome.
Where small accounts leak most
Measuring dollars instead of R. A profitable-looking hour is often just the hour you happened to size up in, which hides a falling edge until drawdown arrives.
Bucketing by exit time. A trade entered at 11:20 and closed at 12:40 lands in the wrong hour and contaminates both.
Ignoring fee drag per bucket. Two ticks of MES is $10 gross and $7.52 net. At 118 trades in a dead block, the fee line alone outsizes the edge.
Trusting a 9-trade hour. Small samples produce spectacular expectancy numbers that vanish on the next 20 trades.
Cutting the setup instead of the hour. This is the expensive one, because it deletes the profitable instances along with the losing ones.
Never re-running the audit. Session character shifts with volatility regimes. A 2024 hourly profile does not describe a 2026 tape.
Where TradeOlogy fits
The audit above is mechanical, and doing it by hand in a spreadsheet is where most traders quit. TradeOlogy connects to your brokerage account or takes a CSV import, rebuilds executions into round trips, and reports expectancy, profit factor, win rate and drawdown broken out by setup, by session and by hour across stocks, options, futures and crypto.
The practical value is the filtering. Isolate one setup tag, then split it by hour, and you can see whether a losing strategy is genuinely broken or simply mistimed. Compare the same tag across sessions and the fix is usually a schedule change rather than a strategy change. If your import is dropping fills or merging trades incorrectly, the hourly numbers are fiction, which is the point made in the piece on bad journal data. Multi-asset traders splitting attention across futures and crypto get a single log instead of four disconnected ones, covered in the multi-asset journal breakdown. Free trial, cancel anytime.
FAQ
How many trades do I need before an hourly breakdown means anything?
Twenty closed round trips per bucket is the working minimum, and 50 is where the expectancy figure gets stable. Below 20 the standard error on win rate is wide enough that a genuinely negative hour can print positive. If an hour has 9 trades and a +0.6R expectancy, that is noise wearing a suit.
Should I bucket by entry time or exit time?
Entry time, always, and stay consistent. The entry is the decision you are auditing, and it carries the market conditions you actually assessed. Bucketing by exit smears long-held trades into hours where you made no decision at all.
Why does my profit factor look fine while net P&L is flat?
Profit factor is computed on gross figures in most tools, so commissions and slippage sit outside it. A book with profit factor 1.6 and 380 trades on a small account can easily net zero once $957 of round turns are subtracted. Recompute profit factor net of fees per hour, and the dead block usually drops below 1.0.
Does this work for crypto, where there is no session close?
Yes, but you have to impose the buckets yourself. Use UTC hours and group them around the Asia, Europe and US overlaps, since liquidity and realised range still follow those blocks even though the venue never closes. The same expectancy-by-column logic used for futures applies directly.
What if my best hour is the one I cannot trade because of my job?
Then size the hours you can trade to their actual expectancy, or move to a holding period that fits your schedule. Forcing intraday frequency into a low-range window is the most common reason a part-time small account stays flat, and the sizing consequences are laid out in the swing versus day trading comparison.
The standard to hold yourself to
Set a rule and enforce it with data: no hour stays in your trading plan unless it clears positive expectancy net of fees across at least 20 round trips. Re-run that check every quarter, because the 2026 volatility profile will not match last year's and your hourly map ages faster than your setup list does. Everything that fails the test gets cut, not tweaked.
Verdict: Reviewing day trading performance by session and hour is not a refinement exercise, it is the fastest way to find the block of clock time funding your losses. On a small account, cutting one negative two-hour window typically does more for net P&L than any new setup, because the edge you already have is being spent in hours where the range cannot pay for your targets.