

The best trading journal software for a multi-asset trader is the platform that turns stocks, options, futures and crypto fills into round trips on one risk-normalised scale, so a $400 options win and a $400 ES win can be compared honestly. If you want the recommendation before the reasoning: TradeOlogy is the pick for traders running all four of those asset classes, because it builds one combined equity curve and slices performance by setup, session and hour instead of by instrument. Most traders in this position do not have a software problem yet. They have four separate logs, four separate win rates, and no idea what their real peak-to-trough drawdown was last quarter.
Why multi-asset traders pick the wrong journal
The usual approach is one tool per instrument. A broker statement for equities, a futures platform report, a crypto exchange export, and a spreadsheet for options because nothing else handles the premium properly. Each one produces a win rate. None of them produce your account's risk profile.
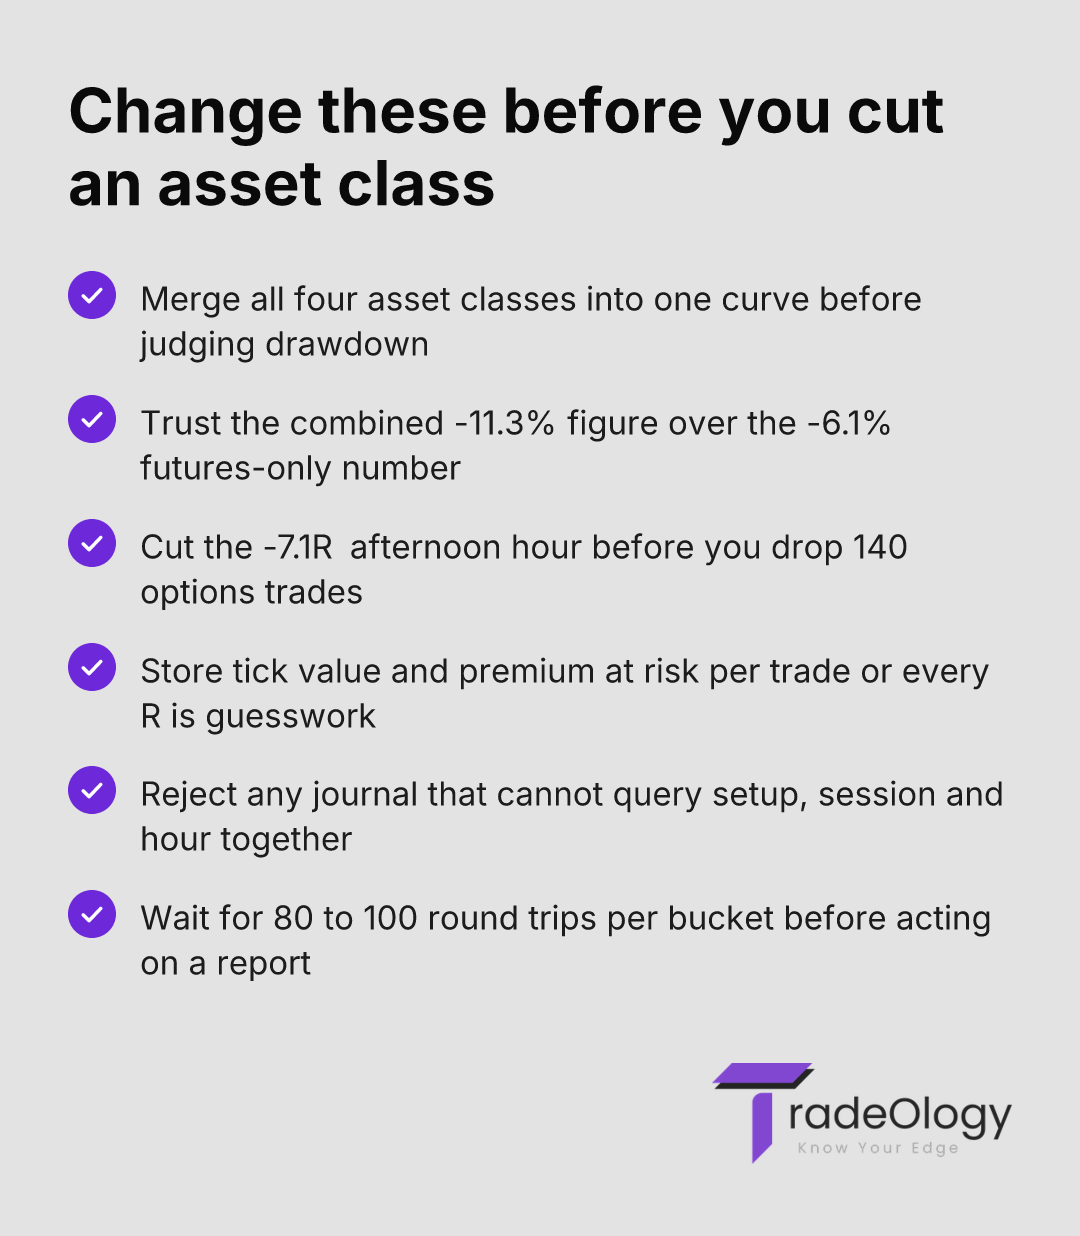
That split creates two measurable errors. First, drawdown vanishes. Your futures log shows -6.1% at worst and your crypto log shows -4.8%, so you assume you have never been down more than 6%. Merge the two curves by date and the combined figure was -11.3%, because the bad days landed together. You sized your account against a number that never existed.
Second, raw dollars become the comparison currency. One ES contract at 4 points is $200 by contract specification, not by conviction — the CME contract multiplier decides that for you. A 30-delta option spread risking $180 of premium is a different animal entirely. Ranking your setups on gross P&L just ranks your instruments by size. That is the difference between a trade log and a journal, and it costs real money.
What the best trading journal software actually has to solve
Three things, and everything else is decoration.
One: risk normalisation. Every round trip needs an R-multiple based on the risk you actually had on at entry — stop distance times tick value for futures, premium at risk for a defined-risk option structure, share count times stop distance for equities, position notional times stop percentage for crypto. Without that field, cross-asset expectancy is arithmetic on unlike units.
Two: one equity curve. Drawdown is an account-level fact. It has to be calculated on the merged, date-ordered series, not per instrument.
Three: tagging that survives the merge. Setup, session and hour must be queryable across all four asset classes at once. That is where the useful finding lives.
Here is the part that most comparison articles miss. When you merge a genuinely multi-asset log and rank expectancy two ways — by asset class and by hour of entry — the hour buckets almost always show wider dispersion. In the sample below, expectancy across asset classes ranged from -0.06R to +0.14R, a spread of 0.2R. Across hour-of-day buckets it ranged from -0.31R to +0.42R, a spread of 0.73R. Roughly three times wider. Traders who journal per instrument reach for the obvious fix and cut crypto or drop options. They cut a 0.2R problem and leave a 0.73R problem running. Check it in your own data before you believe me: the histogram bar where win rate falls under 40% is far more likely to be a clock than a ticker.
The shortlist, ranked on multi-asset handling
TradeOlogy — stocks, options, futures and crypto in one normalised log, with broker connection or CSV import, and breakdowns by setup, session and hour. Free trial requires a card, cancel anytime, then a monthly subscription. For the trader who runs three or more asset classes and needs one drawdown figure. Honest limitation: no forex or currency pairs, no prop-firm or funded-account dashboards, and no built-in backtesting engine.
TraderSync — broad broker integration list and solid automated import. Sold in three monthly tiers with an annual discount; full analytics sit on the upper tier. For the trader with five brokers who wants imports to just work. Limitation: dense interface, and you pay up to reach the reports you came for.
Tradezella — strong journaling and a backtesting module in one subscription, billed monthly or annually. For the trader who wants to replay setups as well as review them. Limitation: verify current crypto and futures instrument coverage against your specific venues before committing.
Tradervue — long-standing, reliable for equities, options and futures, with a free tier plus paid monthly tiers. For the equities-heavy trader adding futures. Limitation: crypto handling is thin and the interface shows its age.
Edgewonk — one annual licence, no monthly option, manual or file-based import. For the trader who wants deep behavioural fields and does not mind data entry. Limitation: manual entry breaks down above roughly 200 trades a month.
Spreadsheet — free and infinitely flexible. For fewer than 30 trades a month. Limitation: you maintain every tick value and option multiplier by hand, and one wrong cell corrupts a quarter of expectancy data.
Tool | Asset coverage | Cross-asset R normalisation | Pricing model | Main limitation |
|---|---|---|---|---|
TradeOlogy | Stocks, options, futures, crypto | Yes, one merged equity curve | Card-backed free trial, then monthly, cancel anytime | No forex, no backtester |
TraderSync | Stocks, options, futures, crypto, forex | Partial, tier dependent | Three monthly tiers, annual discount | Best reports gated to top tier |
Tradezella | Stocks, options, futures, crypto | Partial | Monthly or annual subscription | Check venue coverage first |
Tradervue | Stocks, options, futures | Limited | Free tier plus paid monthly tiers | Weak crypto support |
Edgewonk | Manual, any instrument | Manual only | Annual licence, one payment | Data entry load |
Spreadsheet | Anything you build | Only if you build it | Free | Breaks above 200 trades a month |
How to test a candidate in one weekend
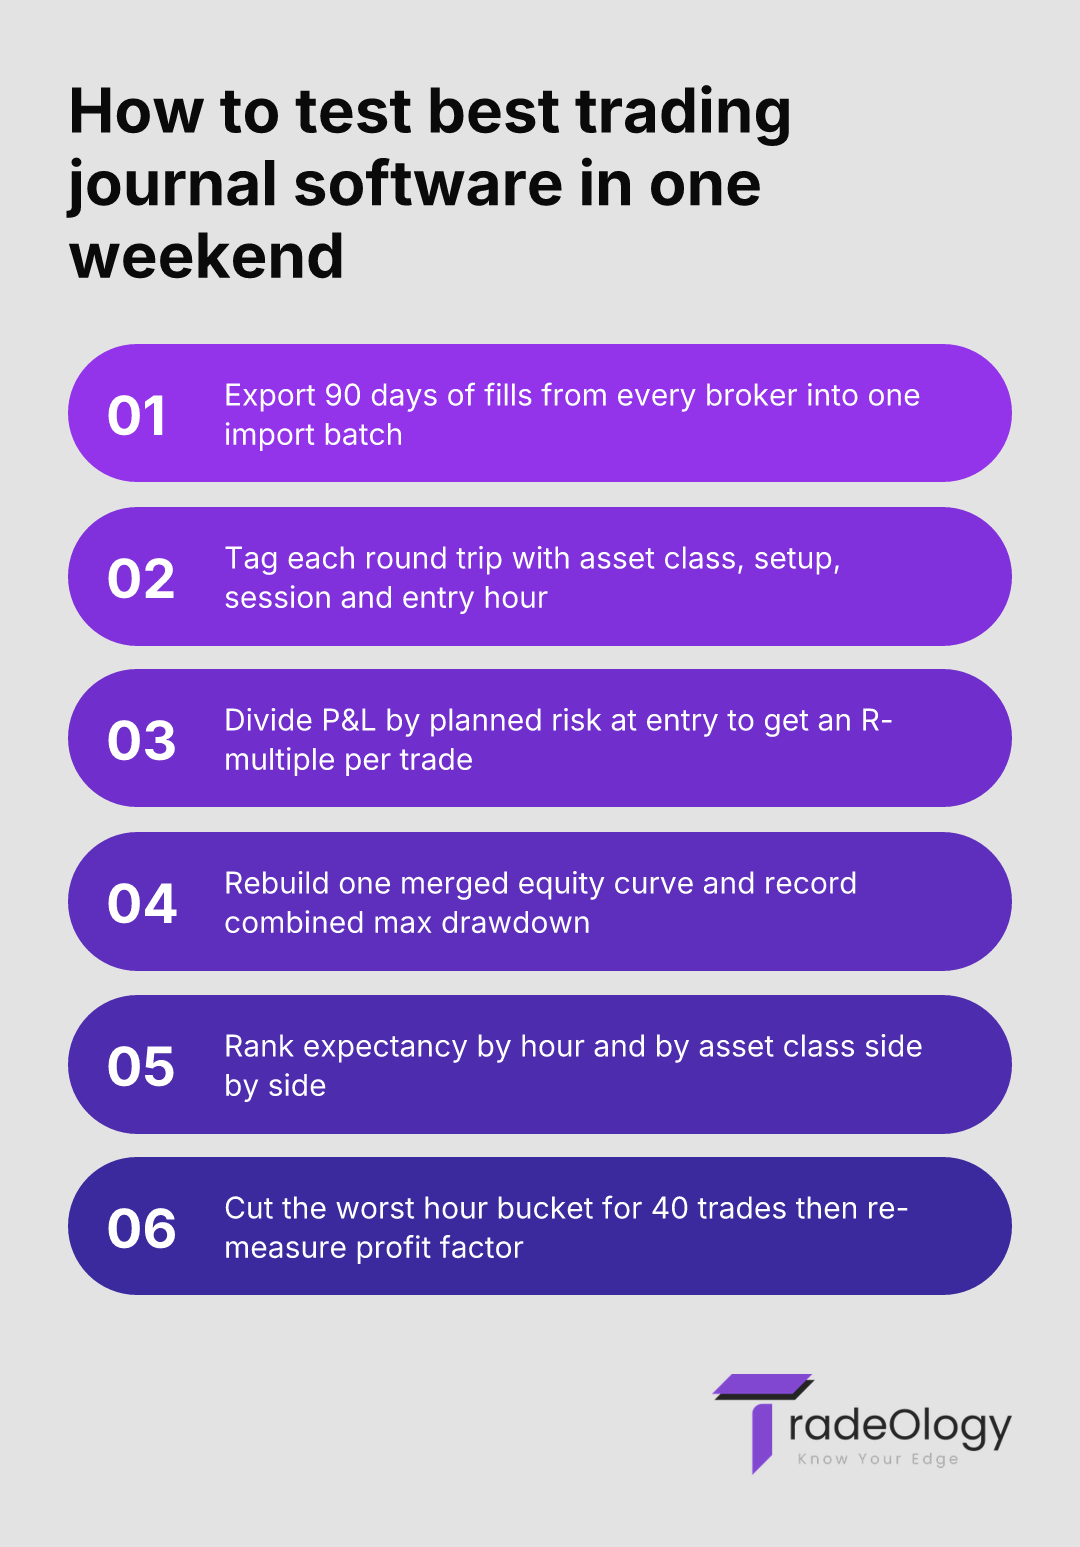
Do not evaluate on feature lists. Evaluate on whether the tool can answer five questions from your own last 90 days of fills.
Export 90 days of fills from every broker and exchange into one import batch.
Tag each round trip with asset class, setup, session and entry hour before running any report.
Calculate an R-multiple per trade using planned risk at entry, not realised loss.
Compare combined max drawdown against the worst single-asset drawdown and write both numbers down.
Eliminate the lowest-expectancy hour bucket for 40 trades, then re-measure profit factor.
If the tool cannot do all five without manual reconstruction, it is not a multi asset trade log. It is a receipt archive. That distinction is the whole point of a review process that finds real errors.
Reading the output
Metric | What it actually means | Action to take |
|---|---|---|
Combined drawdown deeper than worst single-asset drawdown | Your instruments are correlated on the days that matter. | Size from the combined figure and cap concurrent risk. |
Hourly expectancy spread wider than asset-class spread | Timing is the leak, not instrument selection. | Ban the worst hour bucket for 40 trades, then re-check. |
Profit factor 1.18 with 2.1R average winners | Sizing and frequency problem, not a setup problem. | Flat-risk every entry and remove discretionary size-ups. |
Options trades logged without premium at risk | Every cross-asset R-multiple in the log is fiction. | Re-import with per-contract risk or exclude from expectancy. |
Crypto win rate stable but expectancy negative | Weekend and overnight fills are paying for the good hours. | Segment by crypto session and cut the dead window. |
A worked example
A $50,000 account, 312 round trips over six months, flat risk of 0.75% or $375 per trade. Breakdown: 140 options trades, 96 micro and full futures trades, 52 equity trades, 24 crypto trades.
Gross P&L by asset class said futures were the business: +$9,200 futures, +$1,400 equities, -$3,100 options, -$610 crypto. The trader's plan was to drop options entirely.
Normalised to R, the story changed. Futures ran +0.14R per trade, equities +0.09R, options -0.06R, crypto -0.05R. Futures looked dominant in dollars mostly because the contract size was four times the equity risk. The genuine spread across asset classes was 0.2R.
Then the same 312 trades sorted by entry hour. The 09:30–10:30 bucket produced +11.8R across all four asset classes. The 14:00–15:00 bucket produced -7.1R, and options accounted for only 41% of that damage. Every instrument bled in that hour. Combined max drawdown came in at -11.3%, against -6.1% on the futures log alone. Cutting options would have removed 45% of trade count and about 8% of the loss driver. Cutting the afternoon hour removed 62% of it, across the whole book. See the same pattern in futures sizing data.
If your combined equity curve shows a deeper drawdown than any single asset class you trade, your instruments are not diversification — they are the same trade wearing four tickers, and your position sizing is built on a number that never happened.
Mistakes that survive a software upgrade
Logging option P&L without premium at risk. Every R-multiple downstream becomes unusable, and expectancy comparisons quietly break.
Tagging by instrument only. Instrument is the least informative field you own. Setup, session and hour carry the signal.
Comparing crypto and equity win rates directly. Crypto runs 24/7 while futures and equity sessions close, so trade frequency alone distorts the comparison.
Judging a new journal after 30 trades. At 30 trades the standard deviation of expectancy swamps the signal. Nothing meaningful appears before 80 to 100 round trips per bucket.
Keeping the spreadsheet as a shadow copy. Two logs means two truths, and traders quote whichever one looks better. That is how bad journal data keeps P&L flat.
Where TradeOlogy fits
Connect a brokerage account or import a CSV, and TradeOlogy assembles executions into round trips across stocks, options, futures and crypto, then reports expectancy, profit factor, win rate and drawdown on the merged series. The breakdowns that matter for this problem are setup, session and hour, which is exactly how you find a -7.1R clock instead of blaming an asset class.
What it will not do: forex, funded-account tooling, or a backtesting engine. It also will not decide anything for you — it is a measurement layer, not a fix. The free trial requires a card and you can cancel anytime, which is enough runway to import 90 days of fills and check whether your hourly spread really is three times your asset-class spread.
FAQ
Can one journal calculate R-multiples for both options premium and futures ticks?
Yes, provided it stores risk per trade as a field rather than deriving it from the exit. Futures risk is stop distance times tick value times contracts; defined-risk options risk is net premium at risk. A tool that only imports P&L cannot rebuild either number, which is why CSV-only imports often need a manual risk column.
Why does my combined equity curve show deeper drawdown than any single asset class?
Because your losses cluster on the same dates. Index futures, high-beta equities and large-cap crypto all respond to the same macro prints, so a bad session hits three logs at once. Size from the combined figure, not the friendliest individual one.
Should crypto sit in the same trade journal app as stocks when crypto never closes?
Same log, different session tags. Merging is essential for accurate drawdown, but comparing a 24-hour market to a 6.5-hour session without an hour field produces nonsense. Tag crypto by session window and the comparison holds up.
How many trades before a trading analytics platform tells me anything reliable?
Roughly 80 to 100 round trips per bucket you want to judge. Below that, the standard deviation of expectancy is wider than the differences you are trying to measure, and traders cut profitable setups on noise.
Does a free tier ever work for a four-asset trader?
Only under about 30 trades a month across all instruments. Above that, the maintenance cost of hand-keyed multipliers and tick values exceeds any subscription you were avoiding.
The standard to hold your choice to
Import your last 90 days into any candidate and ask it for one number: combined max drawdown. If the tool cannot produce it across stocks, options, futures and crypto in a single series, it does not qualify as the best trading journal software for your account, regardless of how good the charts look.
Verdict: For a trader running all four asset classes, the best trading journal software is the one that normalises every fill to R and reports on one merged equity curve — TradeOlogy does that, and the payoff is finding out your worst hour costs three times more than your worst instrument.