

Why Your “Good Enough” Trading Journal Is Costing You Money
You’ve had the week. A string of disciplined, high-quality trades. The equity curve is ticking up. Then it happens. One, maybe two, impulsive trades that violate every rule you have. In a few minutes, you give back the entire week’s profits, plus some. The frustration isn’t just about the loss; it’s the nauseating feeling of self-sabotage. You know what you did wrong, but you can’t seem to stop the pattern. Here’s the hard truth: your current method of tracking trades is failing you. That simple spreadsheet or notebook you call a trading journal is likely a glorified diary of wins and losses, not the powerful diagnostic tool it needs to be. It tells you what happened, but it completely fails to show you why it keeps happening, ensuring your costliest errors remain hidden in plain sight, ready to blow up your next hot streak.
Quick Formula: The Real Cost of a Repeated Error
Stop thinking about losses as one-off events. Your repeated mistakes have a quantifiable cost that drags down your entire performance. Use this to put a dollar value on what your bad habits are costing your account.
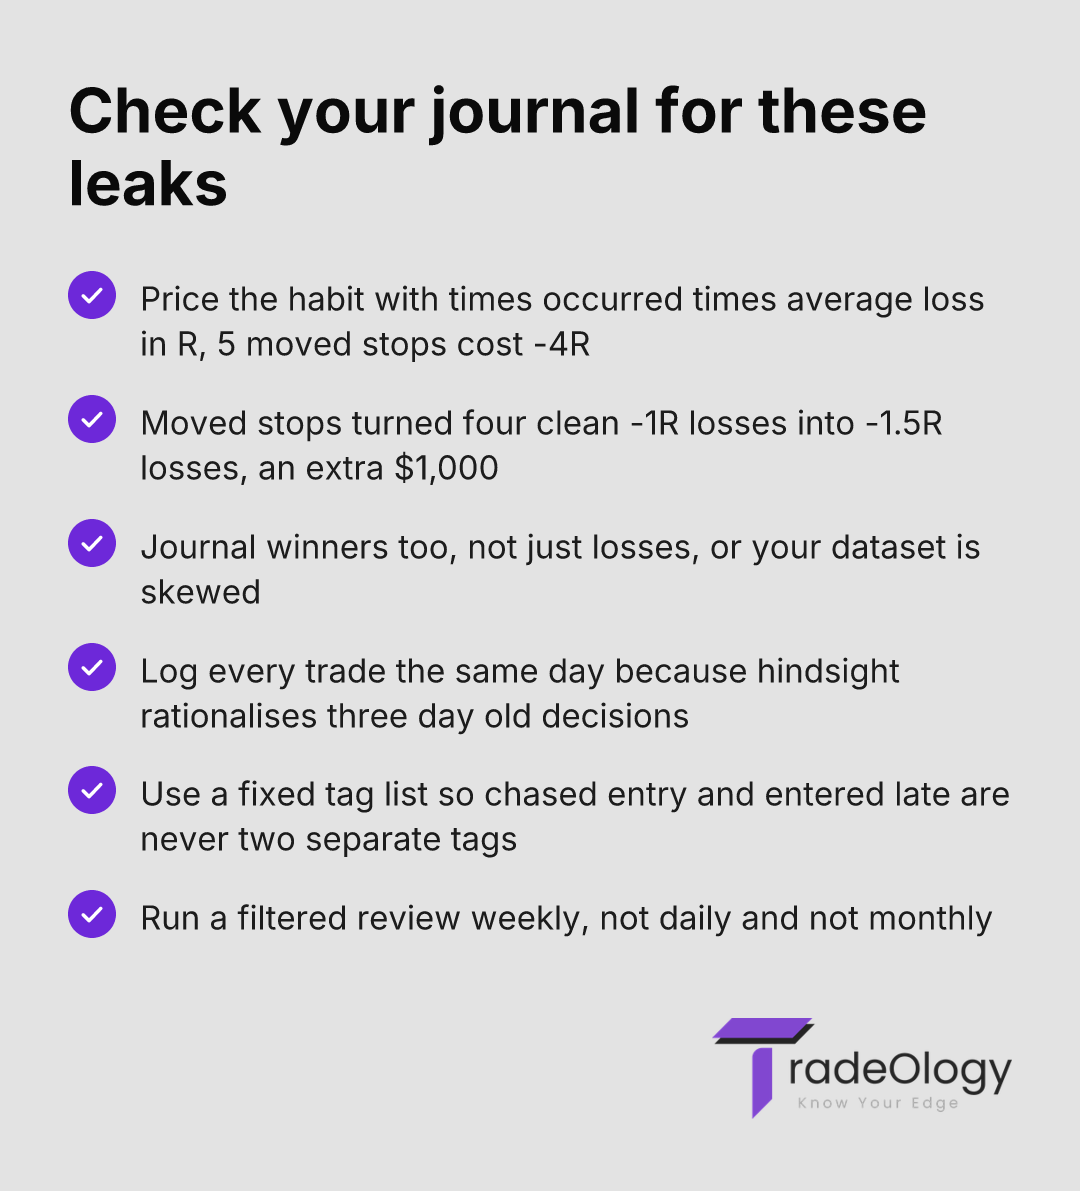
Cost of Habitual Error = (Number of Times Error Occurred) x (Average Loss From That Error in R)
Example: You moved your stop loss 5 times last month, resulting in an average loss of -1.8R instead of -1R. The cost is 5 x -0.8R = -4R. That’s 4% of your account gone, just from one bad habit.
The Problem: Most Traders Keep a Useless Trading Journal
Let’s be honest. Most traders treat their journal like a chore. It’s an afterthought—a quick note about the P&L, maybe the instrument, and a vague comment like “got stopped out.” This is not a trading journal; it’s a receipt. It provides zero insight for meaningful trade analysis and makes performance improvement impossible.
There are two types of useless journals:
The Emotional Diary: This journal is filled with entries like “felt good about this trade,” “was scared and took profits early,” or “got angry and revenge traded.” While acknowledging psychology is important, this is just emotional venting. It lacks the objective data needed to identify the triggers for those emotions. You know you revenge traded, but you don’t know the specific setup, time of day, or market condition that consistently leads to it.
The Data Dump: This is the other extreme—a massive spreadsheet with 50 columns of data you never actually look at. You track everything from the moon phase to the MACD crossover on five different timeframes. The result is analysis paralysis. You have so much data that it’s impossible to see the signal for the noise.
Both methods fail because they don’t connect specific actions to specific outcomes in a structured way. They don’t help you isolate the variables that matter, leaving you to repeat the same trading mistakes indefinitely and wonder why your P&L is flat-lining.
Explanation: Your Journal Is a P&L Diagnostic Tool
A professional trader’s journal is not a history book. It’s a surgical instrument. Its primary purpose is to find the statistical outliers—both positive and negative—in your trading. It exists to answer one question: “What one or two patterns, if fixed or amplified, would have the greatest impact on my equity curve?” Without this, you are just guessing. You’re relying on memory and emotion, which are notoriously unreliable in the high-pressure environment of trading.
Think of it like a professional athlete reviewing game tape. They aren’t just watching the final score. They’re analyzing their footwork on a specific play, their positioning against a certain opponent, and their decision-making under pressure. They are looking for the small, repeatable mechanics that lead to success or failure. Your trading journal must serve the same function. It’s where you break down your performance into objective, reviewable components.
The goal is to move from subjective feelings (“I think I cut my winners too soon”) to objective facts (“My data shows that on trades with 3R potential, I consistently exit at 1.5R, cutting my expectancy by 50%”). This shift is everything. It turns a vague psychological leak into a concrete, solvable problem with a measurable P&L impact.
A Practical Framework for a High-Impact Trading Journal
Stop recording useless data. A functional journal tracks the lifecycle of a trade—the hypothesis, the execution, and the result—with just enough data to be insightful. Anything more is a waste of time. Structure your entries to force a critical review of the actions that matter. Here’s a framework that works.
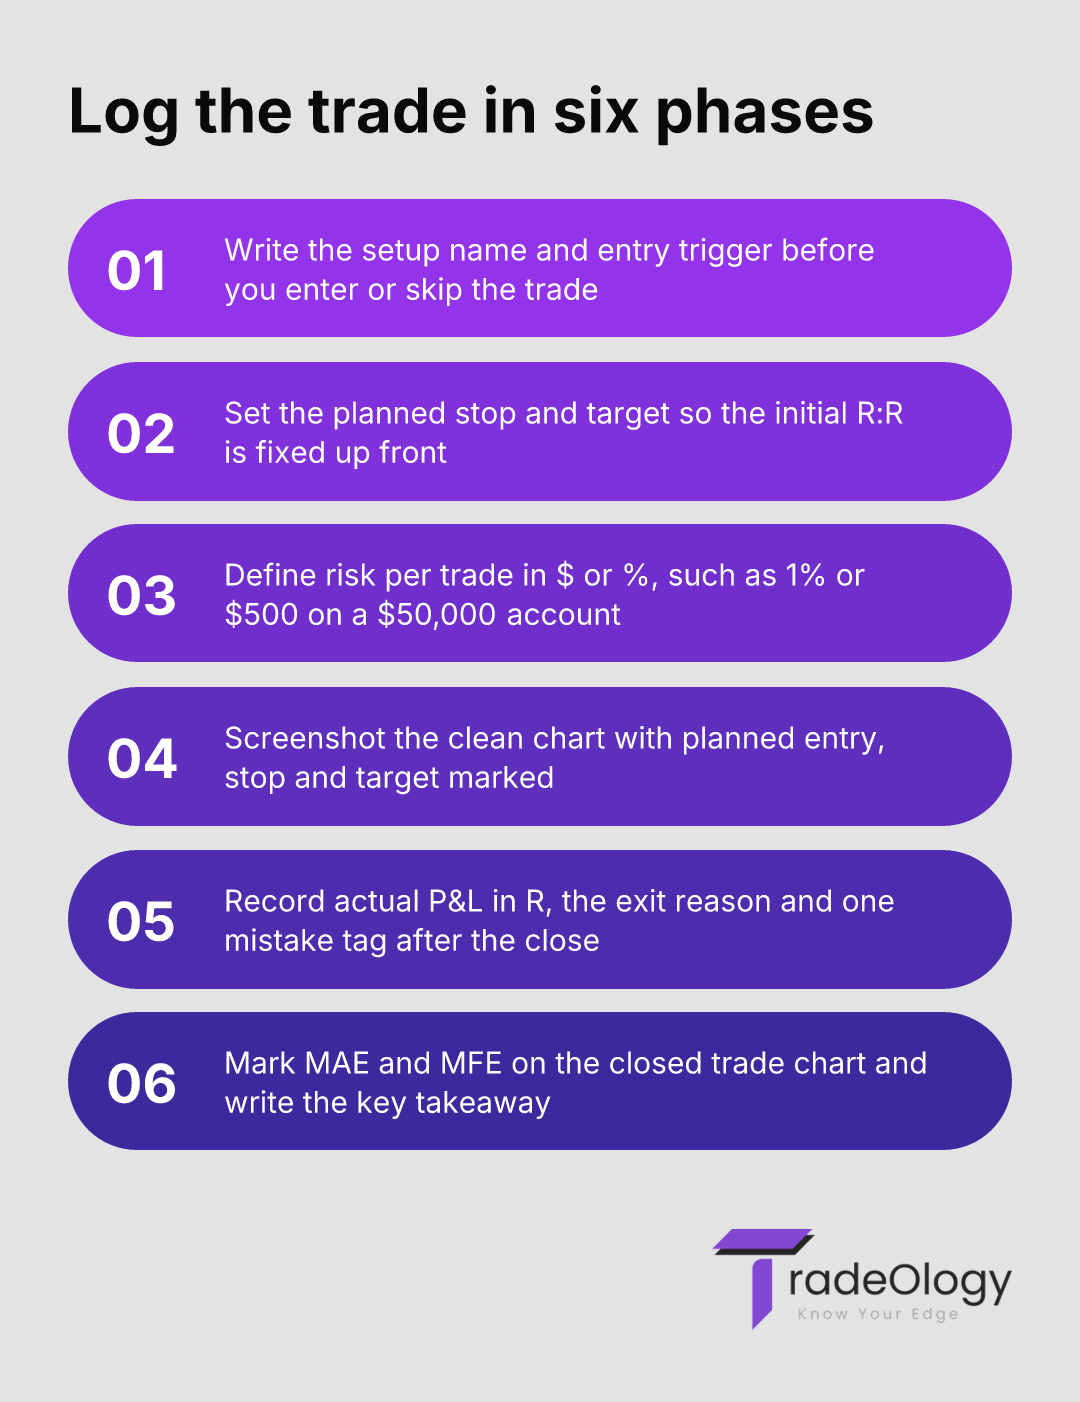
Phase 1: Pre-Trade (The Hypothesis)
This is your plan. It must be logged before you enter the trade. If you don't have time to write this down, the trade is impulsive and you shouldn’t be taking it. This section defines your edge and your risk.
Setup/Strategy Name: Give your strategies a specific name (e.g., "5-min ORB," "Head & Shoulders Failure"). This allows you to filter and see which setups actually make money.
Entry Trigger: What exact event signals your entry? (e.g., "Close above 9 EMA on 15-min chart").
Planned Stop Loss: The exact price where your thesis is proven wrong. No exceptions.
Planned Target: The price where you plan to take profits. This defines your initial Risk:Reward ratio.
Risk per Trade (% or $): How much of your account are you risking if your stop is hit? See our guide on mastering position sizing for more on this.
Screenshot of the Chart: An annotated image of the clean chart *before* you enter. Mark the planned entry, stop, and target.
Phase 2: Post-Trade (The Reality)
This is what actually happened. It’s where your plan meets the chaos of the market. Record this immediately after the trade is closed.
Actual P&L: The dollar amount or R-multiple gained or lost.
Exit Reason: Why did you close the trade? (e.g., "Hit Target," "Hit Stop," "Time-based exit," "Discretionary exit - fear").
Mistake Tag (The Most Important Field): Did you make an error? Tag it. Create a drop-down list of your common mistakes: "Moved Stop," "Entered Too Early," "Chased Price," "Cut Winner Short," "Took Unplanned Trade," "Sizing Error." If there was no mistake, tag it "Disciplined Execution."
Screenshot of the Completed Trade: An annotated image showing your entry, exit, and price path. Mark the Maximum Adverse Excursion (MAE) and Maximum Favorable Excursion (MFE).
Review Notes: One or two sentences on the key takeaway. What did you learn?
Real Trading Example: Finding a Hidden Cost
Let’s put this into practice. Imagine a trader with a $50,000 account, risking 1% ($500) per trade.
The Plan (Pre-Trade Log):
Setup: Bear Flag breakdown on the 1-hour chart.
Entry Trigger: Short on a candle close below the flag’s lower trendline at $150.50.
Planned Stop Loss: $151.00 (a 50-cent risk).
Planned Target: $149.00 (a 3:1 R:R).
Position Size: 1,000 shares ($500 risk / $0.50 stop distance).
The Reality (Post-Trade Log): The trade triggers as planned. Price moves down to $150.00, then reverses sharply toward the stop. The trader, fearing a stop-out, moves the stop loss to $151.25 to "give it more room." Price continues up and stops them out at $151.25.
Actual P&L: -$750 (-1.5R).
Exit Reason: Hit (moved) Stop Loss.
Mistake Tag: Moved Stop.
During a weekly review, the trader filters their trading journal by the "Moved Stop" tag. They discover this has happened on 4 of their 10 losses this month. Instead of four clean -1R losses (-4R total), they have four losses averaging -1.5R (-6R total). The simple act of moving the stop has cost them an extra 2R, or $1,000, this month alone. This is no longer a vague feeling; it’s a data-proven, expensive habit that requires immediate attention.
Common Mistakes That Invalidate Your Trading Journal
Even with a good structure, bad habits will render your analysis useless. These are the most common ways traders sabotage their own performance reviews.
Inconsistent Journaling: You only journal your losing trades or only when you feel like it. This creates a skewed dataset. A surgeon can't improve if they only review the operations that went wrong. You need the full picture to understand what separates your wins from your losses. This is one of the main reasons why traders fail.
Journaling Long After the Fact: Trying to remember the details of a trade you took three days ago is impossible. Your brain will rationalize your decisions. You must log the trade while the context and your mindset are fresh. Doing it later pollutes the data with hindsight bias.
Focusing Only on P&L: P&L is an output, not a process. A well-executed trade can lose money, and a badly executed trade can win. Judging a trade solely by its outcome is a rookie mistake. Your focus should be on execution quality. Did you follow your plan? Tagging your trades by mistake type is far more valuable than sorting them by profit.
Not Using a Standardized Tagging System: If you write "chased entry" one day and "entered late" the next, your ability to filter and aggregate data is compromised. Create a fixed list of setups and mistakes and use them religiously. Consistency is key for effective trade analysis.
Never Reviewing the Data: A journal that isn't reviewed is just a diary. You must schedule time—at least weekly—to run the numbers. Filter by setup, mistake tag, R:R, and time of day. Find the patterns. This review session is where the real work gets done.
How TradeOlogy Automates and Enhances Your Trading Journal
The framework above is powerful, but let’s be direct: manual journaling is tedious. It’s prone to errors, inconsistency, and the simple human tendency to avoid painful tasks. After a big loss, the last thing you want to do is open a spreadsheet and document your failure. This is where a dedicated tool becomes mission-critical for serious traders.
TradeOlogy is not just a digital notebook; it’s an analytics engine designed to do the heavy lifting for you. It automatically imports your trades, calculating P&L, R-multiples, and position sizes. This eliminates data entry errors and the friction of manual logging.
More importantly, it provides the tools to perform the deep trade analysis that a spreadsheet can’t. With a few clicks, you can filter by any custom tag, see your performance per setup, and visualize your equity curve based on specific mistakes. Imagine instantly seeing a chart of your performance on "Disciplined Trades" vs. "Trades Where I Moved My Stop." The impact is immediate. TradeOlogy surfaces the insights buried in your trading activity, turning raw performance data into a clear roadmap for improvement and helping you improve your trading expectancy.
Frequently Asked Questions (FAQ)
1. What’s the single most important data point to track in a trading journal?
The "Mistake Tag." Hands down. While P&L, setup, and R:R are all vital, the mistake tag is what forces you to be honest about your execution. It’s the primary driver for corrective action. If you tracked nothing else, knowing which 1-2 mistakes are causing 80% of your unforced losses would be enough to dramatically change your P&L. It directly answers the question, "Why am I losing money?" and separates process errors from strategy issues.
2. How often should I review my trading journal?
A deep review should be a non-negotiable weekly ritual. Daily review is too frequent; you’ll get lost in the noise of individual trades. Monthly is not frequent enough; bad habits will become entrenched. A weekly review allows you to spot a negative pattern after a handful of occurrences, letting you intervene before it causes a significant drawdown. This is the sweet spot for meaningful analysis and course correction.
3. My strategy is discretionary. How do I journal that without it becoming an emotional diary?
Discretionary trading still operates within a framework. The key is to standardize your "reasons for discretion." Instead of writing "I felt the market was turning," create tags for your discretionary observations, such as "Unusual Volume Spike," "Key Level Rejection," or "Correlated Market Divergence." This process, known as "structuring the unstructured," turns your gut feel into a set of observable, taggable market conditions. You can then analyze the performance of trades taken with these specific discretionary overlays.
4. I hate journaling. How can I stay consistent?
First, simplify. Track only the essential data points listed in the framework above. Second, link the process directly to your P&L by calculating the cost of your errors. When you see that one mistake cost you $2,000 last month, the motivation to track it increases. Finally, automate as much as possible with a tool like TradeOlogy. By removing the friction of manual data entry, you can focus on the high-value part: the analysis. If you see your journal as a tool for making more money, not a chore, your consistency will follow.
Conclusion: Stop Recording History and Start Building Your Edge
Your trading account is bleeding from a thousand small cuts, and your basic spreadsheet isn't a bandage—it’s a blindfold. A high-performance trading journal is the only tool sharp enough to find the source of those wounds. It’s not about passively recording what happened; it’s about actively hunting for the statistical patterns that define your success and failure. You must move beyond simply recording P&L and start tagging your execution errors with brutal honesty.
This is the work that separates professional traders from the 90% who fail. Amateurs focus on finding the perfect entry. Professionals focus on eliminating costly mistakes. Your edge isn’t found in a magic indicator; it’s carved out, day by day, through meticulous self-analysis. The insights you need to build a consistently profitable career are waiting in your trade data. A structured trading journal is the only way to uncover them.