

When it comes to trading analytics, understanding the fundamentals is essential for any trader.
How Advanced Trading Analytics Reveal Your True Edge
You follow your trading plan meticulously. You risk the same 1% on every trade. You wait for your A+ setups. Yet, at the end of the month, your account is flat or slightly down. What gives? The answer isn’t always found in a new indicator or a different market. It’s buried in your own trading data. Most traders have a vague sense of what works, but they can’t prove it with numbers. They rely on memory and gut feel—both of which are notoriously unreliable. This is where a commitment to deep trading analytics separates the consistently profitable from the crowd. By systematically analyzing your performance, you move from guessing to knowing. True confidence in trading doesn’t come from a string of wins; it comes from understanding your statistical edge, and robust trading analytics is the only path to discovering it.
Edge Discovery Formula: (Setup Tagging + Performance Filtering) * Trade Volume = Actionable Insight
This isn’t a mathematical equation, but a conceptual one. By consistently tagging each trade with a specific setup name and then filtering your performance by those tags, you can isolate which strategies actually make money over a large sample size of trades.
The Problem: Trading Blind with Incomplete Data
Many traders think they’re analyzing their performance by looking at their monthly P&L statement. This is like a doctor diagnosing a patient based only on their body weight. It tells you something, but it misses the critical details needed for an effective prescription. You might have one strategy that’s a consistent winner, generating a +0.8R average profit. However, it’s being completely negated by two other setups you trade that have a -0.4R expectancy each. On the surface, your account is stagnant, leading you to question your entire approach.
Without detailed trading analytics, you’re flying blind. You don’t know which setup is your bread and butter and which one is bleeding you dry. This leads to a destructive cycle: you abandon a profitable system because it’s being dragged down by unprofitable habits you aren’t even aware of. You jump from strategy to strategy, searching for a "holy grail" that doesn’t exist, when the key to profitability was already in your hands—you just couldn’t see it in the data.
What Are Trading Analytics?
At its core, trading analytics is the practice of dissecting your trade data to understand the characteristics of your winning and losing trades. It goes far beyond your account balance. It’s about creating a detailed, quantitative picture of your trading habits and strategy performance. While your broker gives you a receipt of your transactions, genuine analytics tools help you find the patterns hidden within those transactions.
For a retail trader, this means logging critical data points for every trade: the strategy or setup name, the instrument traded, the time of day, your entry and exit prices, stop loss placement, and even qualitative data like your emotional state or the reasons for taking the trade. Once collected, this information allows you to filter and segment your performance in powerful ways. You can ask specific, data-driven questions like:
What is my average profit/loss on "Opening Range Breakout" trades versus "Mean Reversion" trades?
Is my win rate higher when I trade in the first hour of the market open?
What is my trading expectancy for long trades on the QQQs versus short trades on SPY?
Answering these questions transforms your review process from a subjective guess into an objective analysis, helping you improve trading performance with surgical precision.
A Practical Framework for Discovering Your Edge
Ready to move from haphazard guessing to data-driven execution? This framework will guide you in using trading analytics to pinpoint your most profitable setups. It requires discipline, but the payoff is a clear understanding of your statistical edge.
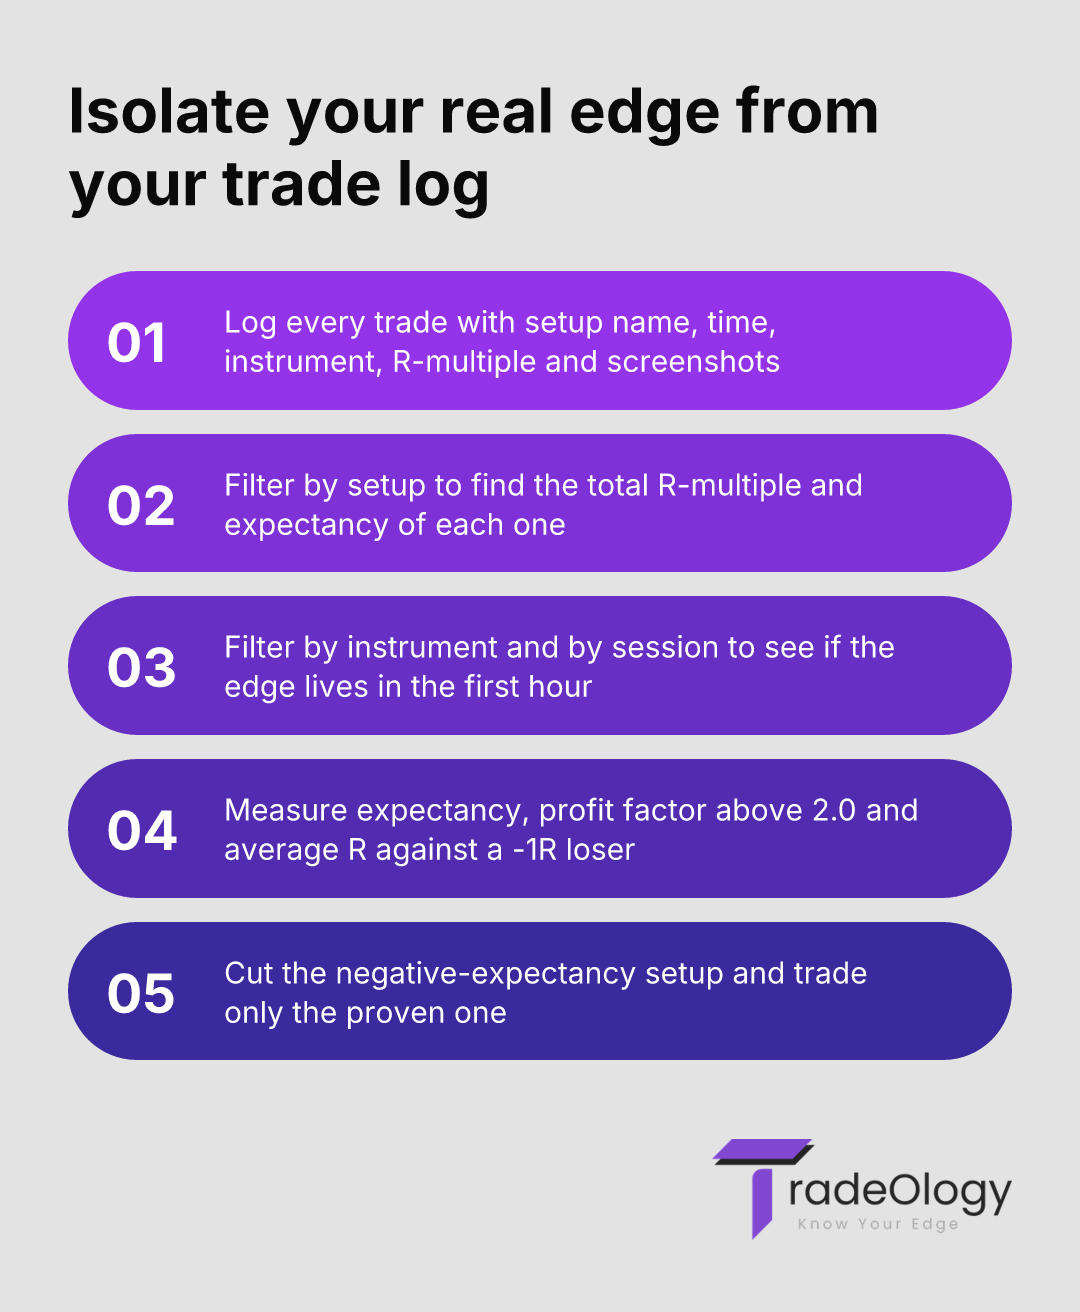
Step 1: Commit to Meticulous Data Logging
You cannot analyze what you do not track. Every single trade must be logged with a consistent set of data points. A spreadsheet can work, but dedicated trading journal software is far more efficient. Your log should include:
Setup Name: A specific, non-ambiguous name (e.g., "5-min ORB," "Head & Shoulders Breakdown," "Red to Green Move").
Date & Time: Entry and exit times are crucial for time-based analysis.
Instrument/Symbol: e.g., AAPL, ES (S&P 500 E-mini), EUR/USD.
Risk Multiple (R): The most important metric. If you risked $100 and made $250, your R-multiple is +2.5R. If you lost, it’s -1R.
Screenshots: A picture of the setup before entry and after the trade is closed provides invaluable context during review.
Qualitative Notes: Your rationale, emotional state, and any deviations from your plan.
Step 2: Tag, Filter, and Segment
This is where the magic happens. With a solid dataset, you can now filter your trades to find patterns. Good analytics tools automate this process. Start with broad questions and narrow them down.
Filter by Setup: Isolate all trades tagged "5-min ORB." What is the total R-multiple? What is the expectancy?
Filter by Instrument: Isolate all your trades on NVDA. Is your performance better long or short on this stock?
Filter by Time: Analyze your performance during the first hour of trading versus the lunch hour or end-of-day. Many traders find their edge is confined to specific market sessions.
Step 3: Analyze Key Performance Metrics (Beyond Win Rate)
Win rate is a vanity metric; expectancy is what pays the bills. Focus on these metrics for each filtered segment:
Expectancy: The average amount you expect to win or lose per trade. A positive expectancy means you have a statistical edge. Learn more about what trading expectancy is and why it matters.
Profit Factor: Gross profit divided by gross loss. A value above 2.0 is considered very robust.
Average R-Multiple: Your average win in R terms, and your average loss. Is your average winner significantly larger than your average loser (which should be -1R)?
Step 4: Form a Hypothesis and Take Action
Your analysis will reveal truths. For example: "My analysis of 150 trades shows that my 'Bull Flag' setup has a +0.6R expectancy when traded on large-cap tech stocks between 9:30 AM and 11:00 AM. However, my 'Reversal' setups after 1:00 PM have a -0.4R expectancy."
The action is clear: focus exclusively on the high-expectancy setup and stop trading the negative-expectancy one. This single decision, backed by data, can be the turning point for a trader.
Real Trading Example: Finding the Edge
Let's consider a trader named Alex with a $30,000 account. Alex risks 1% per trade, which is $300 (or -1R). Over three months, Alex logs 120 trades. The account is hovering around breakeven, and Alex feels frustrated.
Using trading analytics software, Alex tags every trade with one of two setups: "Trend Continuation" or "Support/Resistance Fakeout."
The overall P&L is approximately +$600, or +2R over 120 trades—barely profitable.
But when Alex filters by setup, a different story emerges:
Trend Continuation Trades:
Number of Trades: 70
Total R-Profit: +28R
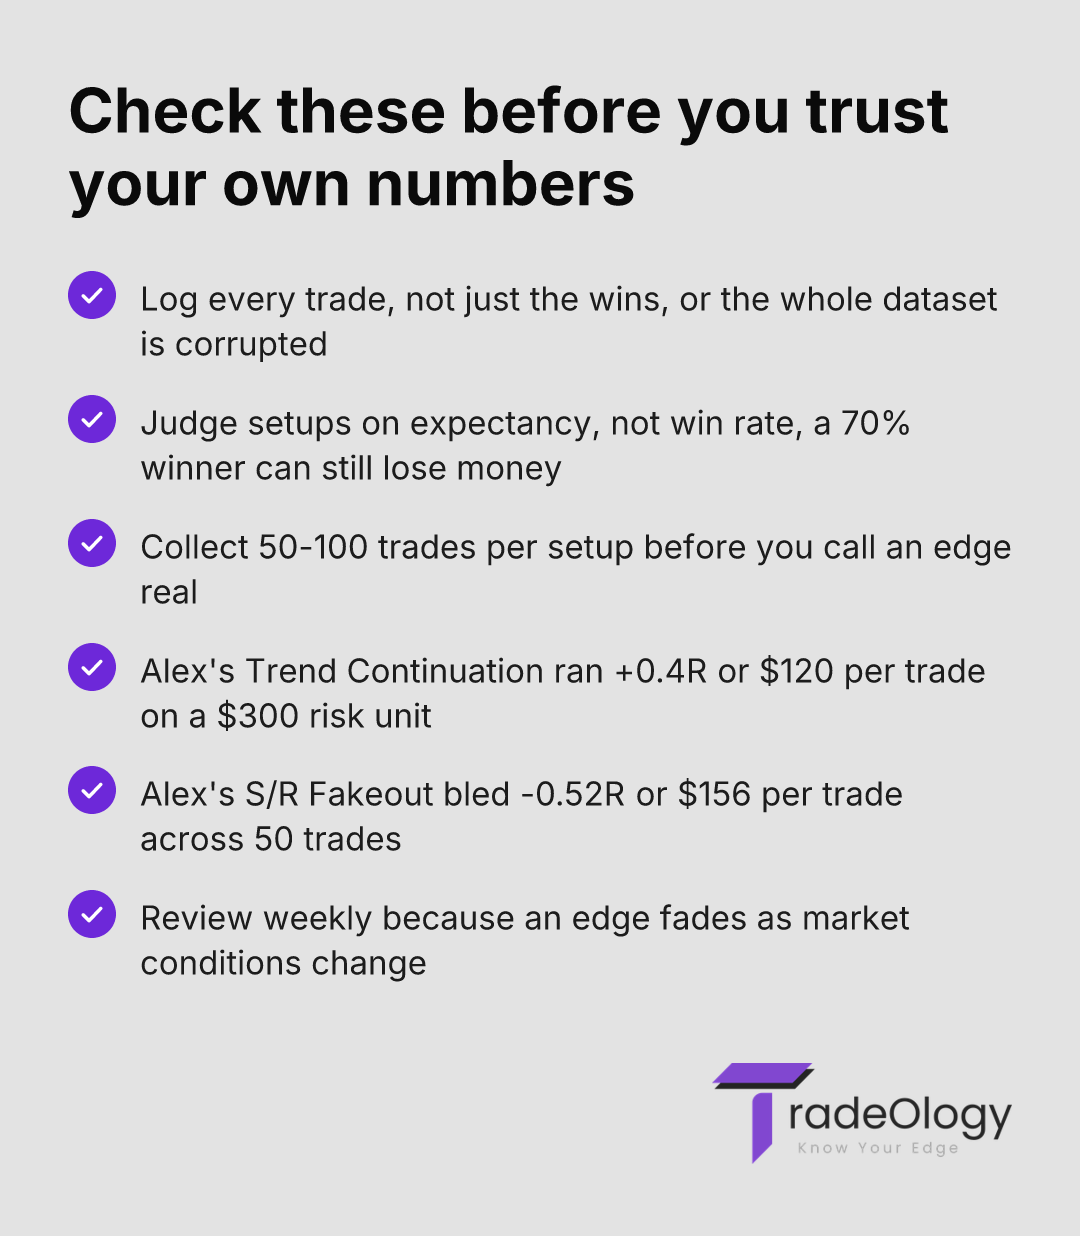
Expectancy: +0.4R per trade (28R / 70 trades)
S/R Fakeout Trades:
Number of Trades: 50
Total R-Loss: -26R
Expectancy: -0.52R per trade (-26R / 50 trades)
The data is crystal clear. The "Trend Continuation" setup is a solid winner, generating on average $120 per trade (0.4 * $300 risk). The "S/R Fakeout" setup is a consistent loser, costing an average of $156 per trade. Alex was trading one profitable strategy and one losing strategy, resulting in near breakeven performance. The actionable insight is to double down on the trend continuation plays and completely eliminate the fakeout setup until it can be proven profitable in a demo account.
Common Mistakes in Trading Analytics
Having access to data isn’t enough. You must use it correctly. Here are common mistakes traders make when trying to implement trading analytics:
Inconsistent Logging: Missing trades or logging incomplete data corrupts your entire dataset. If you only log your wins or your most memorable trades, the analysis is useless. Discipline is everything.
Obsessing Over Win Rate: A high win rate feels good, but it's meaningless without considering the size of your wins and losses. A strategy with a 70% win rate can still lose money if the average win is $50 and the average loss is $150. Focus on expectancy and R-multiple.
Ignoring Sample Size: Drawing conclusions from a small number of trades is a classic error. You can’t determine if a setup has a real edge from just 10 trades. You need a statistically significant sample, typically 50-100 trades *per setup*, to make confident decisions.
Analysis Paralysis: Having too much data can be overwhelming. Some traders get lost in endless filtering and never arrive at an actionable decision. Start simple: focus on your profitability per setup first. That alone will yield the most significant insights.
Not Reviewing Regularly: Analytics isn't a one-time fix. It’s an ongoing process. Your edge can change as market conditions evolve. A weekly trade review process is essential to stay aligned with current market behavior.
How TradeOlogy Transforms Your Trading Analytics
Manually tracking trades in a spreadsheet is better than nothing, but it’s tedious, prone to human error, and lacks sophisticated filtering capabilities. Calculating metrics like expectancy or drawdown per strategy requires complex formulas that can easily break. This is where modern analytics tools come in.
TradeOlogy is designed to be your all-in-one data analysis partner. As a dedicated trading journal software, it simplifies the entire process. You can log trades in seconds, tag them with custom setups, and attach screenshots for context. But the real power lies in the analytics dashboard.
Instead of wrestling with spreadsheets, TradeOlogy automatically calculates all the critical metrics for you. With a few clicks, you can filter your entire trading history by setup, instrument, date, time of day, and dozens of other data points. The platform visualizes your performance, instantly showing you color-coded charts and reports that highlight your strengths and weaknesses. It answers the tough questions for you, pointing you directly toward the setups that make you money and exposing those that don’t. This allows you to spend less time on data entry and more time on high-level analysis and decision-making.
Frequently Asked Questions (FAQ)
How many trades do I need for my trading analytics to be reliable?
While you can start seeing trends with as few as 20-30 trades, most professionals agree that a sample size of at least 100 trades is needed for statistical significance. Importantly, this applies to the specific segment you are analyzing. If you are evaluating a single setup, you need around 100 executions of *that setup* to have high confidence in its expectancy. This is why focusing on 1-3 core setups is so powerful; it allows you to build a reliable dataset faster and gain confidence in your edge sooner.
Can’t I just use the reports from my brokerage?
Brokerage reports are designed for tax and accounting purposes. They provide a summary of your net profit or loss, commissions paid, and a list of transactions. However, they lack the crucial functionality an active trader needs. A broker report cannot tell you your profitability per setup, your performance during certain hours of the day, or your expectancy. They show you *what* happened (your P&L), but dedicated analytics tools show you *why* it happened, which is essential to improve trading performance.
What is the single most important metric to track in my trading analytics?
If you could only track one metric, it should be Expectancy (often measured as average R-multiple per trade). Expectancy is the ultimate performance metric because it combines both your win rate and your risk/reward ratio into a single, elegant figure. A positive expectancy means your strategy has a verifiable statistical edge. A negative expectancy proves it is a losing strategy, regardless of how high the win rate might be. Focusing on improving the expectancy of your primary setups is the most direct path to long-term profitability.
Conclusion: Stop Guessing, Start Measuring
In the competitive world of trading, your gut feelings are a liability. Your memories of big wins and frustrating losses are biased. The only source of truth is your own performance data. Embracing a systematic approach through detailed trading analytics is the definitive step in evolving from an amateur speculator to a professional-minded trader. It illuminates the path, showing you what to trade more, what to trade less, and what to stop trading entirely. The core takeaway is simple: your edge is already present in your trading history, waiting to be discovered. By leveraging powerful trading analytics, you can finally uncover that edge and trade with the data-driven confidence that defines lasting success in the markets.