

Broker sync pulls executions straight from the broker's API on a schedule, while a CSV import uploads a statement file you export by hand, and both build round trips — but only sync reliably preserves every partial fill with its own timestamp. The choice to import trades from broker connection rather than a downloaded file decides whether your futures trade log can see scale-ins at all. Most futures statements report one blended average price per position. Every add-on and partial exit collapses into a single line. Your analytics then measure a trade you never actually placed, and the number that suffers first is expectancy per entry.
Why traders trust the file more than the feed
The CSV feels authoritative because you downloaded it from the broker yourself. It has a filename, a date range, and a total that matches your statement. That total is the problem: it matches at the account level while lying at the execution level.
Futures platforms build statements for reconciliation, not for analytics. Their job is to prove the net position and the net cash. A statement that reports ES long 3 at 5482.25 average has done its job perfectly and destroyed your data. You entered 1 at 5480.00, added 1 at 5482.50, added 1 at 5484.25 after price went against the first two. The file shows one clean entry. Your journal shows a setup with a nice average price and no record that you paid up twice.
What actually decides data quality: fills, timestamps, fees
Three fields determine whether a futures trade log can answer a real question. Fill granularity decides whether you can measure the expectancy of each add-on separately. Timestamp fidelity decides whether your hour-by-hour breakdown means anything. Fee attribution decides whether your profit factor is honest at small size, where commissions and exchange fees on a 1-lot are a meaningful share of the R-multiple.
Miss the first and you cannot separate a good setup from bad management. Miss the second and you will optimise around a session bar that is off by 60 minutes. Miss the third and your 1.31 profit factor is really 1.18. The difference between a journal and a log is exactly this layer of detail.
Head-to-head: import trades from broker sync or upload a CSV
Dimension | Broker sync | CSV trade import |
|---|---|---|
Fill granularity | Every partial fill arrives as its own execution | Depends on the export — many statements blend to one average price |
Timestamp fidelity | Native execution time, usually to the second or better | Often exchange time or date-only, with no timezone label |
Commissions and exchange fees | Attached per contract when the broker exposes them | Frequently a separate fees line, or absent entirely |
History depth | Typically 90 days of backfill, then forward only | Whatever the broker still lets you download, often years |
Failure mode | Silent — a broken token stops the feed while the dashboard looks fine | Loud — you notice the day you forget to export |
Contract roll handling | Distinct symbols such as ESH6 and ESM6 need mapping to one instrument | Same mapping problem, plus manual column edits |
Where sync falls short. It depends entirely on what the API exposes. Some futures brokers publish only end-of-day statement data, so your fills appear the next morning and intraday review is impossible. Tokens expire, and a stalled connection looks identical to a flat week.
Where CSV falls short. The export is a summary written for accountants. You inherit whatever aggregation the broker chose, and you cannot recover fills that were never in the file. It is also a manual habit, and manual habits break in drawdown, which is precisely when the data matters most.
Where we fall short. TradeOlogy's broker connection covers stocks, options, futures and crypto only — no forex — and its backfill stops where the broker's API stops. If you want 2023 and 2024 futures history in the same equity curve as your 2026 trades, you will still be uploading files for the old years and reconciling the overlap by hand.
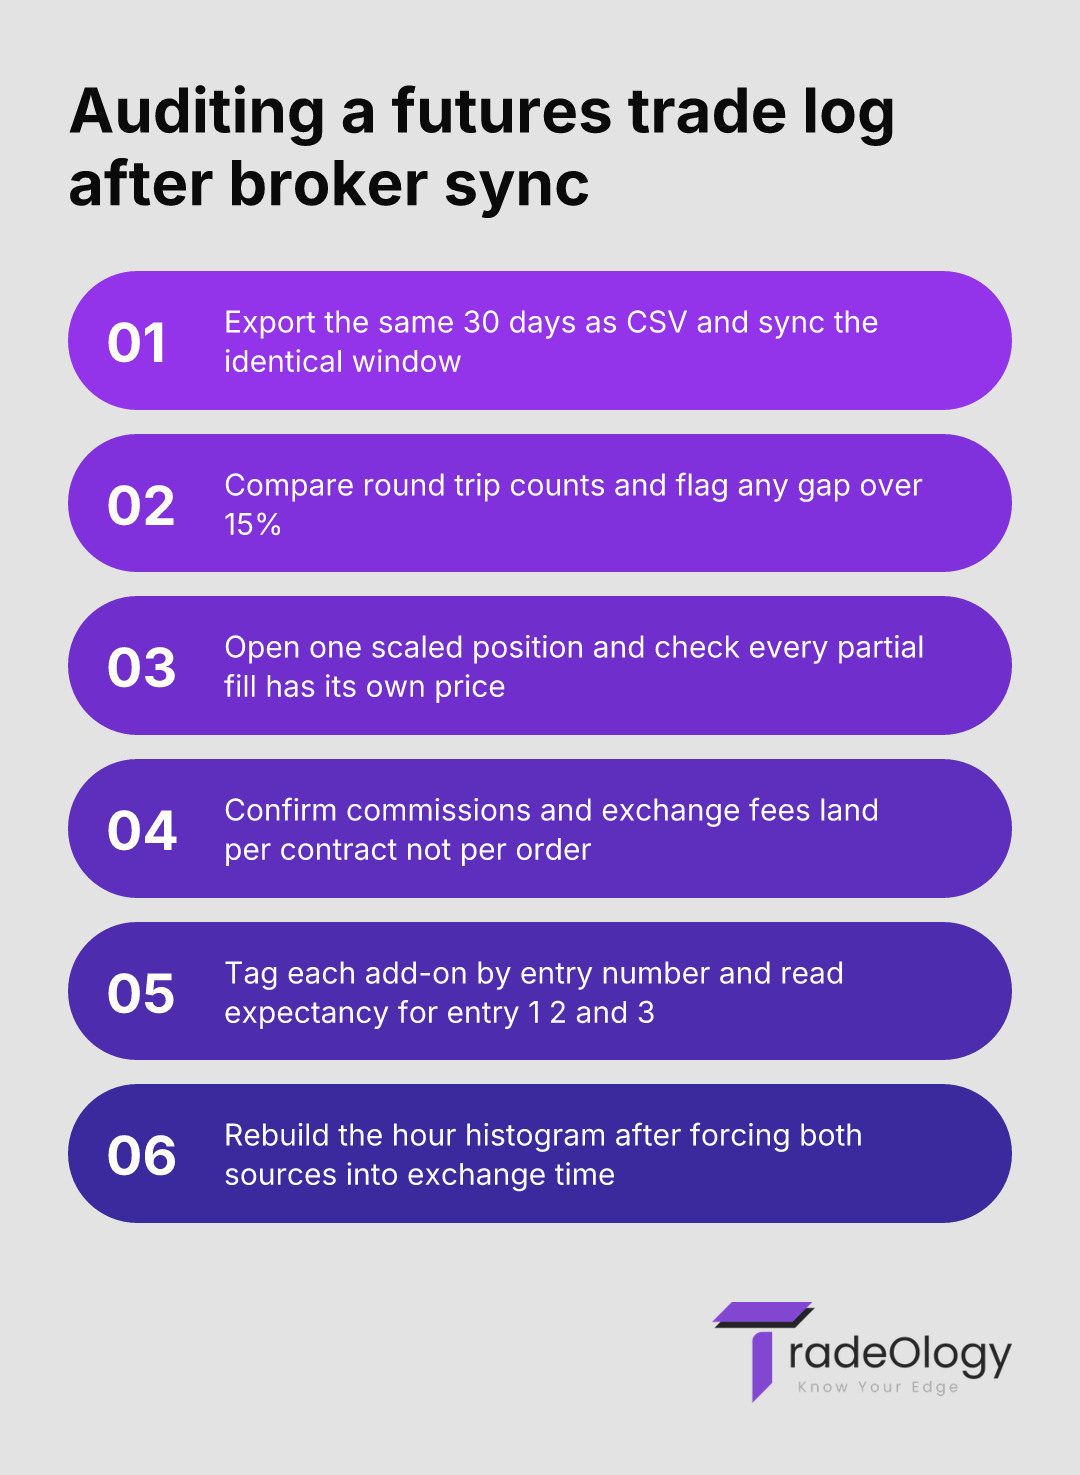
How to audit your futures trade log in one sitting
Run both sources over the same window and treat the difference as your error budget. Thirty days is enough.
Export a 30-day CSV and sync the identical window, then compare total round trip counts.
Filter one scaled position and confirm each partial fill carries its own price and time.
Calculate profit factor with and without fees to see how much of your edge is commissions.
Tag every add-on by entry number, then read expectancy for entry 1, 2 and 3 separately.
Review the hour histogram after forcing both sources into a single timezone.
Reading the mismatch
Metric | What it actually means | Action to take |
|---|---|---|
Round trip count gap over 15% | Your CSV is blending fills into averaged positions. | Switch the setup analytics to synced executions before drawing conclusions. |
Average MAE 0.4R tighter than sync shows | Blended entry prices flatter your stop placement. | Re-measure adverse excursion from the first fill, not the average. |
Identical profit factor, different expectancy | Gross P&L matches but trade count does not. | Stop reporting per-trade averages from the file version. |
Fees line showing $0 on futures | Commissions and exchange fees never made it into the import. | Add a per-contract cost and recompute every R-multiple. |
One hour bar holding 40% of trades | Two sources are stamped in two timezones. | Normalise to exchange time, then rebuild the session breakdown. |
A worked example: $50,000 futures account, 62 sessions
ES trader, $50,000 account, risk capped near $500 per idea, which is 10 points on a 1-lot at $50 per point. Over 62 sessions the broker recorded roughly 300 executions.
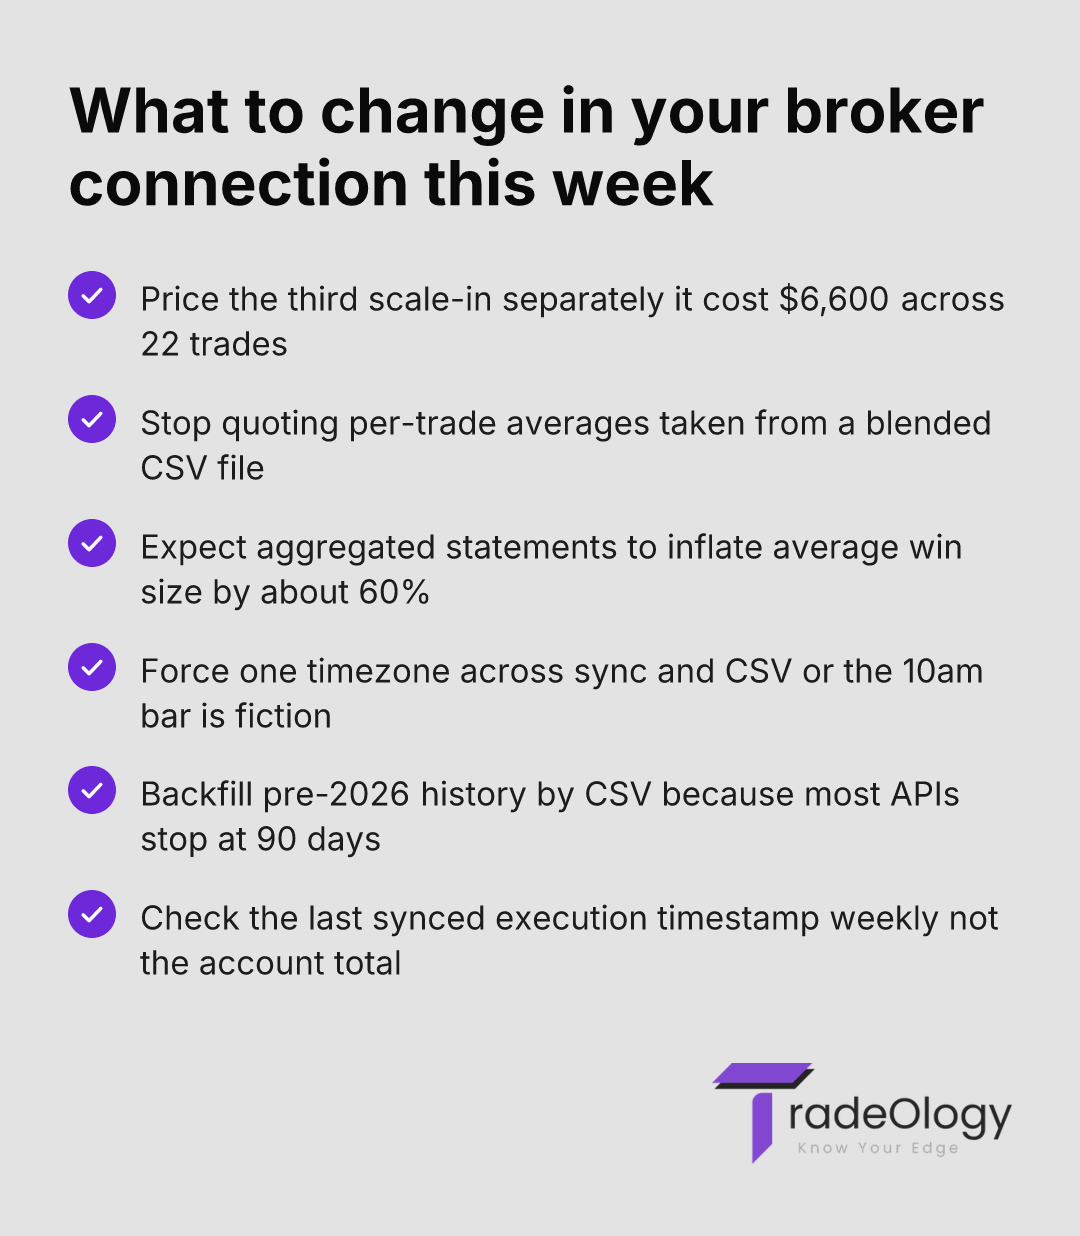
The synced version produced 118 round trips, expectancy of $34 per trade, profit factor 1.31. The CSV version of the same period produced 74 lines and expectancy of $54 per trade. Same gross P&L, same profit factor, and a per-trade average inflated by about 60%. The trader spent two months believing the setup was stronger than it was.
The synced fills answered the real question. Entry 1 carried +0.9R average. Entry 2 was roughly breakeven. Entry 3 — the add placed after price had already gone against him — appeared 22 times and averaged -0.6R, or about -$300 each. That is $6,600 removed from net P&L across the window, against total net of roughly $4,000. Cut the third add and the account clears $10,000 instead. No entry rule changed. The blended CSV could never have shown it, because the third add had no price of its own. Anyone using R-multiple data to separate skill from variance needs fills, not averages.
If your synced round trip count exceeds your CSV round trip count by more than 15%, every per-trade average in your journal — expectancy, average win, average MAE — is overstated, and the gap is hiding a scale-in with negative expectancy.
Common mistakes when moving data in
Running sync and CSV over the same dates, creating duplicate round trips that quietly double your position size in the drawdown chart.
Assuming a green dashboard means a live broker connection — check the last execution timestamp weekly, not the total.
Leaving ESH6 and ESM6 as separate instruments, which splits one strategy across two performance rows after every roll.
Importing prices without fees on a 1-lot, then wondering why a 1.31 profit factor never produces the cash the log promises.
Trusting a CSV with date-only timestamps and then judging session performance from it, which is the fastest way to review trades dishonestly.
Who should pick which
Scale-in and scale-out traders should use broker sync, without exception. Your entire management edge lives in individual fills. A blended file deletes the variable you are trying to test.
Single-entry swing traders can live on a CSV trade import. One fill in, one fill out, no aggregation to lose. A monthly export is enough, provided the file carries fees and a real timestamp.
Traders rebuilding multi-year history should use both. Sync forward from today, CSV backward for the years the API will not reach, and keep a hard cutover date so nothing overlaps.
Traders whose broker only publishes end-of-day data should stay on CSV and stop pretending otherwise. Delayed sync gives you the illusion of automation with none of the granularity. The CME publishes full contract and session specifications — align your timestamps to those hours, whichever route your data takes.
Where TradeOlogy fits
Connect the broker, or upload the file, and the executions become round trips with expectancy, profit factor, win rate and drawdown attached. The part that matters here is the breakdown: performance by setup, by session, and by hour. That is where a blended CSV and a synced feed stop agreeing, and where you find the -0.6R add-on.
Tag add-ons by entry number and the platform will price each one separately. Filter by hour and the histogram bar under 40% win rate stops being an opinion. If your broker limits history, import the old years by CSV and sync from there. The free trial requires a card and you can cancel anytime — run one 30-day window through both routes and compare the round trip counts before you commit to either. Further reading on which numbers to act on sits in the futures journal column that exposes bad sizing and trade analysis tools that change decisions.
FAQ
Why does my round trip count change when I switch from CSV to broker sync?
Because the CSV blended your partial fills into averaged positions and the sync did not. A 118-versus-74 split over 30 days is normal for a trader who scales. The synced count is the real one, and every per-trade average you calculated from the file was overstated.
Does a CSV trade import lose commissions and exchange fees on futures?
Often, yes — many statements report fees as a separate summary line rather than per contract. On a 1-lot that omission can move profit factor from 1.18 to 1.31 on paper. Check whether your fee total appears against individual trades, and add a per-contract cost manually if it does not.
How do I stop DST from mislabeling hour buckets in my futures trade log?
Pick exchange time as your single reference and convert everything to it, including the CSV. Broker files frequently carry no timezone label, so after the March 2026 clock change you get a 60-minute offset that quietly moves trades into the neighbouring bar. If one hour holds an implausible share of your trades, that is the cause.
Can I mix broker sync and CSV import in the same account safely?
Yes, with a hard cutover date. Sync forward from a chosen day, CSV only for dates before it, and never let the ranges overlap. Overlapping imports create duplicate round trips that inflate volume and distort the drawdown curve, and reviewing the right window at the right time becomes pointless once duplicates exist.
Verdict
When you import trades from broker sync you keep every fill, every timestamp and every fee, and that granularity is the only thing that exposes the add-on quietly costing -0.6R. A CSV is adequate for single-entry trading and inadequate the moment you scale. Choose based on how you manage a position, not on which import felt easier to set up.