

An options profit calculator models what an option position is worth at a chosen underlying price, date and implied volatility, then shows the projected profit or loss before you commit capital. The problem is that almost everyone reads the wrong line on it. Traders look at the hockey stick — the payoff at expiration — and then close the position on day 9 of a 21-day contract. The number they planned against and the number that hits their statement were never the same calculation.
Why the expiration line ruins the plan
The payoff diagram on every free calculator is a solved equation. At expiry there is no time value and no volatility input — only intrinsic value. That line is clean, and it is the reason traders trust it.
It is also irrelevant to how you trade. If you buy a 21-day call and manage it on a 5-minute chart, you will be out inside a week. At that point the option still carries extrinsic value, and that extrinsic value is priced by implied volatility, which moves independently of the stock.
The consequence shows up as a specific failure pattern. You get direction right, the stock moves your way, and the position still prints a loss or a fraction of what you expected. Traders then attack the wrong variable. They tighten entries, add a confirmation filter, change the moving average. None of that touches the actual leak, because the leak sits in the strike, the days to expiry and the volatility you paid for.
The one metric that separates a bad option trade from a bad entry
Tag every losing option trade with one binary field: did the underlying finish the hold in the direction of the position? Then divide those trades by total losers. That is your direction-right, money-wrong rate.
Under about 10%, your contract selection is sound and your losses are ordinary directional losses. Above 20%, stop editing your entry rules. You are paying for extrinsic value you cannot recover inside your typical hold, and no entry filter fixes that.
The second number is the projection ratio: realized profit divided by the profit your options profit calculator projected at the same underlying price and the same exit date. Log both at trade entry. A ratio consistently under 0.7 across 20 or more trades means your implied volatility assumption is fiction — you modeled a static IV and traded through a contraction. In 2026, with daily expirations on the major index products and event-driven vol crushing faster than it did five years ago, that gap has widened, not narrowed. Cboe publishes contract-level volatility data you can check your input against.
These two fields turn a payoff diagram into a measurable planning tool. They also give you something to filter by when you review your trades honestly instead of reviewing them for reassurance.
How to plan a trade with an Options Profit Calculator
Run the calculator in this order. The sequence matters more than the tool.
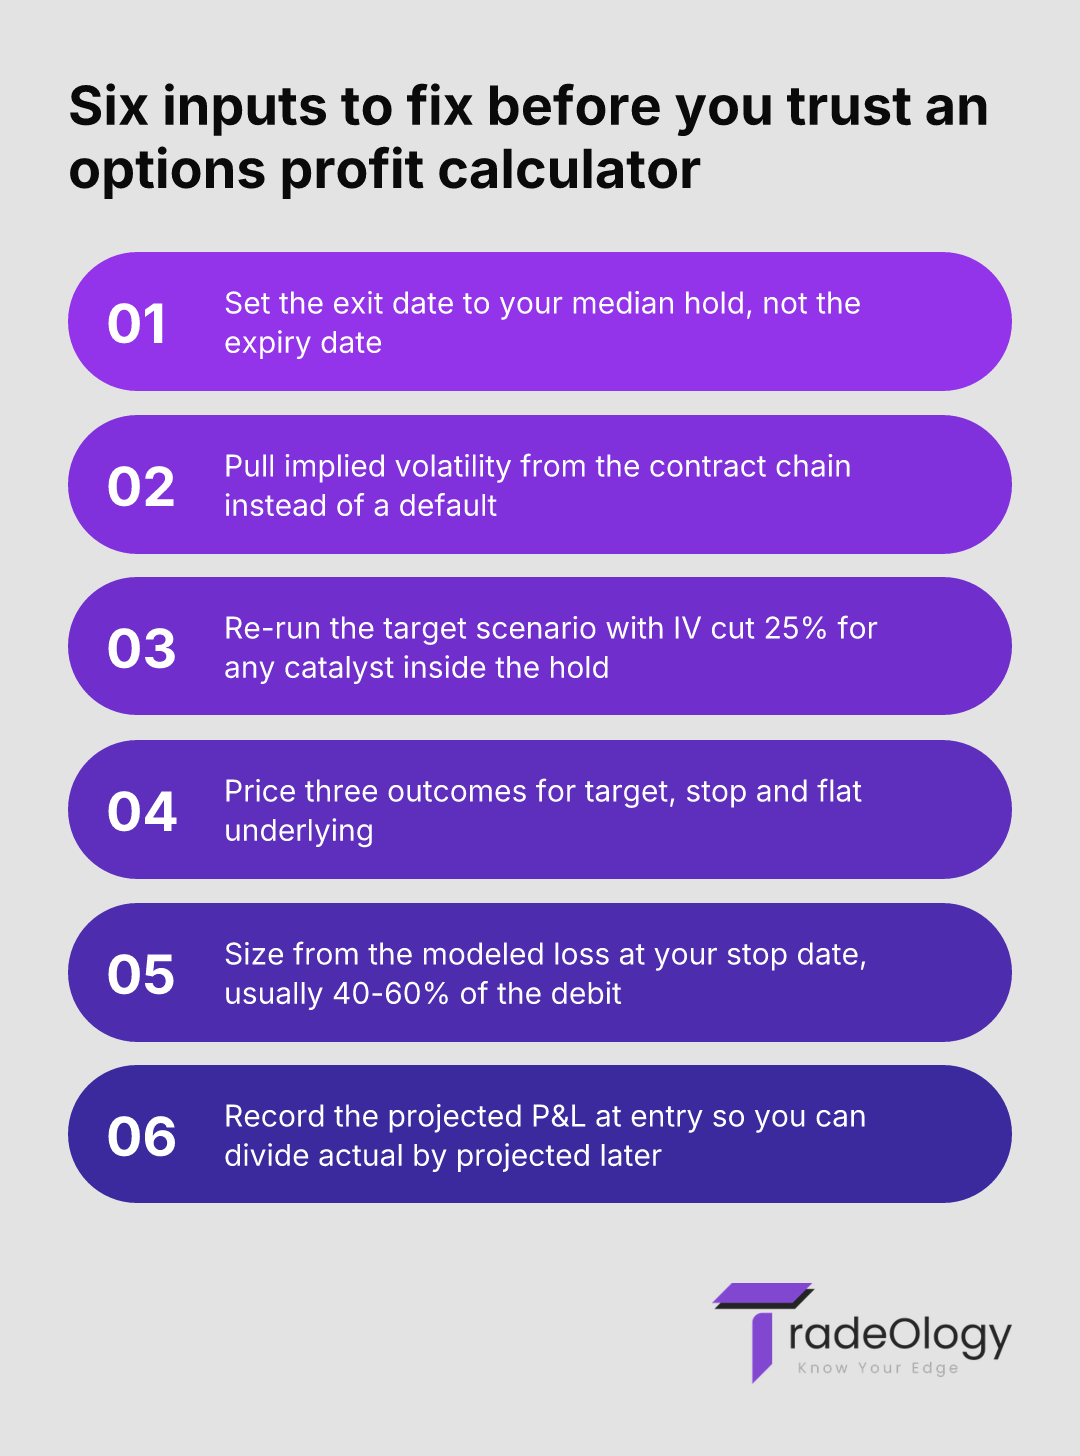
Set the exit date first. Pull your median hold time from your journal. If your directional trades close in 4 days, model day 4, not expiry.
Enter the contract's real implied volatility. Take it from the chain, not from a default. Then run a second scenario with IV cut by 25% if an earnings print, a Fed date or a CPI release sits inside the hold window.
Price three underlying outcomes. Target, stop, and flat. The flat scenario is the one nobody runs, and it tells you what pure decay costs you for being right slowly.
Size from the modeled loss, not the debit. Your risk is the option value at your stop price on your exit date, not the full premium. That number is usually 40-60% of the debit, which means the position you thought was oversized may be undersized.
Record the projection. Write the modeled P&L at target into the trade note. After the close, divide actual by projected.
Setup checklist
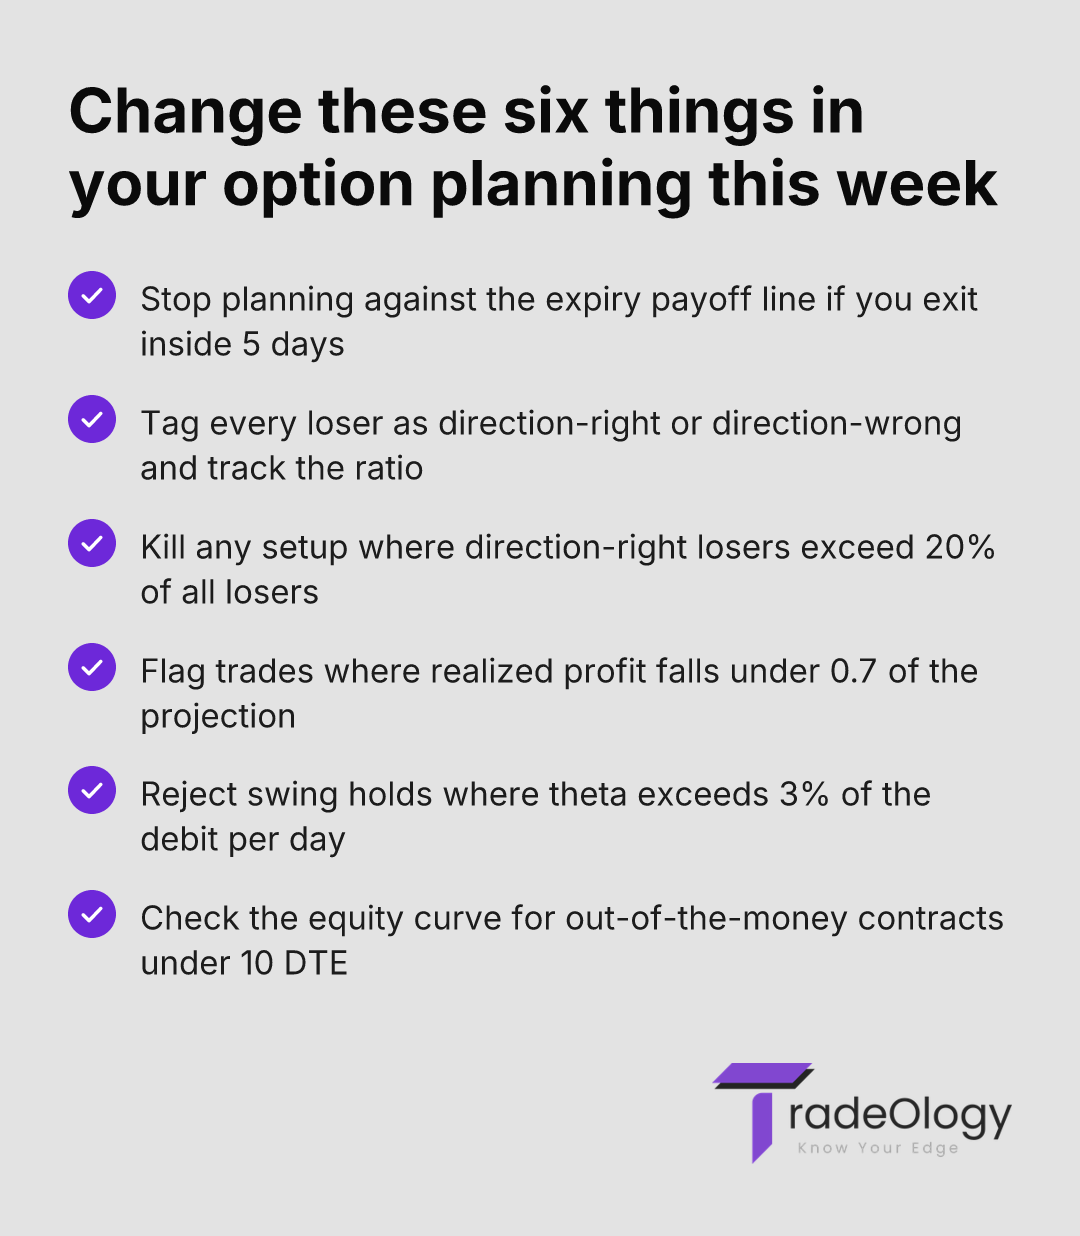
Calculate the option value at your median hold date before you calculate it at expiry.
Compare the target scenario against a second run with IV reduced 25% to see the crush cost.
Tag every loser as direction-right or direction-wrong and track the ratio monthly.
Filter closed trades by projection ratio and eliminate any setup averaging below 0.6.
Review theta as a percentage of debit per day and reject anything above 3% for swing holds.
You can run these scenarios in the TradeOlogy options calculator before the position goes on.
Metric | What it actually means | Action to take |
|---|---|---|
Direction-right, money-wrong > 20% | You are buying too far out of the money or too close to expiry. | Move one strike closer to the money and add 14 days to expiry. |
Projection ratio < 0.7 | Your modeled implied volatility never survived the hold. | Re-run every plan with IV cut 25% and size off that scenario. |
Theta > 3% of debit per day | The clock costs more than your average daily edge. | Extend expiry or shorten the hold to under 3 sessions. |
Win rate 55% with profit factor 1.15 | Premium paid is consuming the edge, not the entry logic. | Cut average debit per contract and re-measure over 30 trades. |
A real trade, run both ways
Account: $50,000. Stock trading at $180. The trader buys 4 contracts of the $185 call, 21 days to expiry, implied volatility 38%. Premium is $4.30, so the debit is $1,720 — 3.4% of the account. Planned stop is a 50% loss of premium, or $860, which is 1.7% risk. That sizing is defensible, and it came from the position sizing rules he actually follows.
Target: $188 within two weeks. The calculator, holding IV at 38%, prices the call at $6.52 on day 10 with the stock at $188. Projected gain: $888, or roughly 1.03R against the $860 risk.
The stock hits $188 on day 10. He was right by 4.4%. But volatility contracted after the catalyst passed, and IV printed 29%. The call was worth $5.42. Realized gain: $448. Projection ratio: 0.50.
One trade, and it is still a winner. Now scale it. Across 40 trades in a quarter, his average projection ratio was 0.58. The plan carried a modeled profit factor of 1.9. The statement showed 1.15. He did not lose his edge — he never had the edge he modeled, because every projection assumed volatility would sit still. That is the kind of gap that only surfaces when you evaluate the strategy against realized data rather than against the plan.
If more than one in five of your losing option trades ended with the underlying moving in your favour, your entries are fine — your strike, expiry and volatility assumptions are the losing trade.
Where option planning breaks down
Modeling at expiry when you manage intraday. The payoff line assumes zero extrinsic value. Your exit date has plenty of it, and it moves against long premium.
Using a default IV instead of the chain. A 10-point IV error on a 21-day contract shifts the projected exit value by more than 20%.
Treating the full debit as risk. If you always stop at 50% of premium, half your capital in the trade was never at risk, and your R-multiples are computed off the wrong denominator.
Buying cheap out-of-the-money contracts because the calculator shows a 900% return. That return needs a move that appears in maybe 5% of your historical setups.
Never logging the projection. Without the modeled number stored at entry, the projection ratio cannot exist, and the leak stays invisible.
Turning projections into a measurable record
TradeOlogy stitches option executions into round trips and reports expectancy, profit factor, win rate and drawdown by setup, session and hour. For options, the useful move is tagging: mark each trade with strike distance, days to expiry at entry and the projected P&L you took from the calculator. Filter on those tags and the pattern shows fast — usually one strike bucket or one expiry bucket dragging the whole book.
Watch the equity curve segment for out-of-the-money contracts under 10 DTE. That is where most option books bleed, and it rarely appears in a blended win rate. Broker option fills also split awkwardly across legs and partial closes, which is why CSV imports drop round trips if the legs are not matched properly. Fix the data before you trust the metric. TradeOlogy covers stocks, options, futures and crypto in one account, and you can cancel anytime.
FAQ
Why does my long call lose money when the stock moves in my direction?
Implied volatility contracted, time decay ate the extrinsic value, or both. A correct directional move of 2-3% will not cover a 9-point IV drop on a short-dated contract. Track the share of losers where direction was right — above 20%, your contract selection is the fault, not your read.
What implied volatility should I enter into an options profit calculator?
Use the IV quoted on the specific contract in the chain, never an index-level or historical figure. Then run a second scenario with that IV reduced by 20-30% if a scheduled catalyst falls inside your hold window. Size the position off the lower scenario.
Does a call option profit calculator work for spreads and short premium?
Yes, provided you model each leg at the same exit date and the same volatility surface. Short premium behaves inversely — a volatility crush that hurts a long call helps a credit spread. The planning error is the same in both directions: modeling at expiry when you close early.
How do I check whether my projections match my actual fills?
Store the modeled P&L at target in the trade note, then divide realized profit by that number after the close. Run it across at least 20 trades. An average below 0.7 means your volatility input is systematically optimistic, and every position built on it is oversized relative to its true expectancy. The setup-level analytics view makes the split obvious.
Verdict
An Options Profit Calculator is only as honest as the exit date and volatility you feed it, and the expiration payoff line is the one output you should almost never plan against. Model the day you actually close, cut the IV, and size off that number. If your realized results come in under 0.7 of your projections, the trade was mispriced before the market opened.