

A broker CSV export lists executions, not trades, so to import broker CSV trades usefully you must match every fill back to the position it opened or closed and group those fills into round trips. Most traders skip that step entirely. They open the file, see a tidy grid of symbols, sides, quantities, prices and timestamps, and treat each row as a trade. Then they build a win rate out of 312 rows that represent 118 actual positions, and wonder why the number never agrees with the equity curve in their broker portal.
The spreadsheet looks clean, which is the problem
A raw execution file is the most trustworthy-looking bad data a trader will ever handle. Every field is populated. Nothing is obviously wrong. The prices are real, the timestamps are real, and the sum of the P&L column often matches the account to the cent.
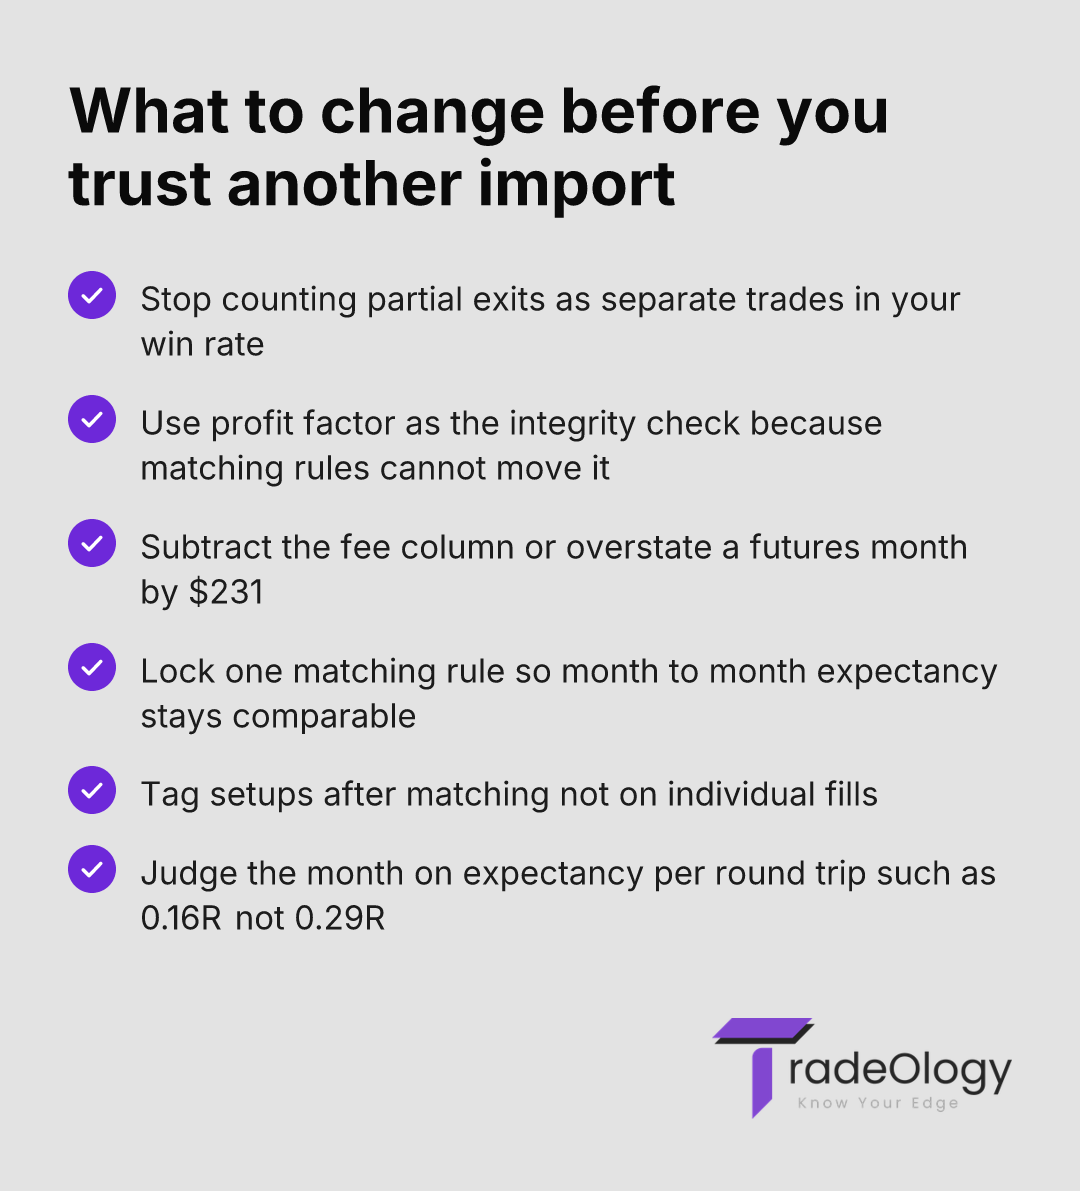
What is missing is structure. The file has no concept of a position. It does not know that your 3-contract entry at 09:41 and your three separate exits at 09:47, 09:52 and 10:14 are one decision. It records four rows, and a naive import records four trades.
The consequence lands directly on your statistics. Scaling out of a winner splits one win into three wins, which is annoying but harmless. Scaling out of a loser is where the damage happens. You take a partial at +0.6R, the runner stops out at -1R, and the file now shows one win and one loss on a position that was net negative. Every loser you managed actively donates a fake win to your win rate.
How to import broker CSV trades without inventing round trips
Start with a ratio nobody looks at: total execution rows divided by matched round trips. Below 2.1, your file is nearly one-in one-out and matching barely matters. Above 3.0, the matching engine is deciding your statistics, not your trading.
Here is the part that contradicts the usual advice about picking the "right" matching method. Run the same CSV twice, once with FIFO lot matching and once with weighted-average matching. Your win rate will move, sometimes by more than 20 points. Your average win and average loss will move. Your profit factor will not move at all, because gross profit and gross loss are just sums of realised dollars and no grouping rule can change a sum.
That gives you a free integrity test. Profit factor is the fingerprint of the file; win rate is the fingerprint of the matching rule. If profit factor shifts between two imports of the same data, you have duplicated or dropped fills. If only win rate shifts, the data is intact and you are simply looking at the same month through a different lens. Most traders spend their energy arguing about which lens is correct. The correct answer is to pick one — FIFO matches the default cost-basis convention the IRS applies to securities — and never change it, because a rule you switch mid-year makes every month-over-month comparison meaningless.
The import sequence that survives an audit
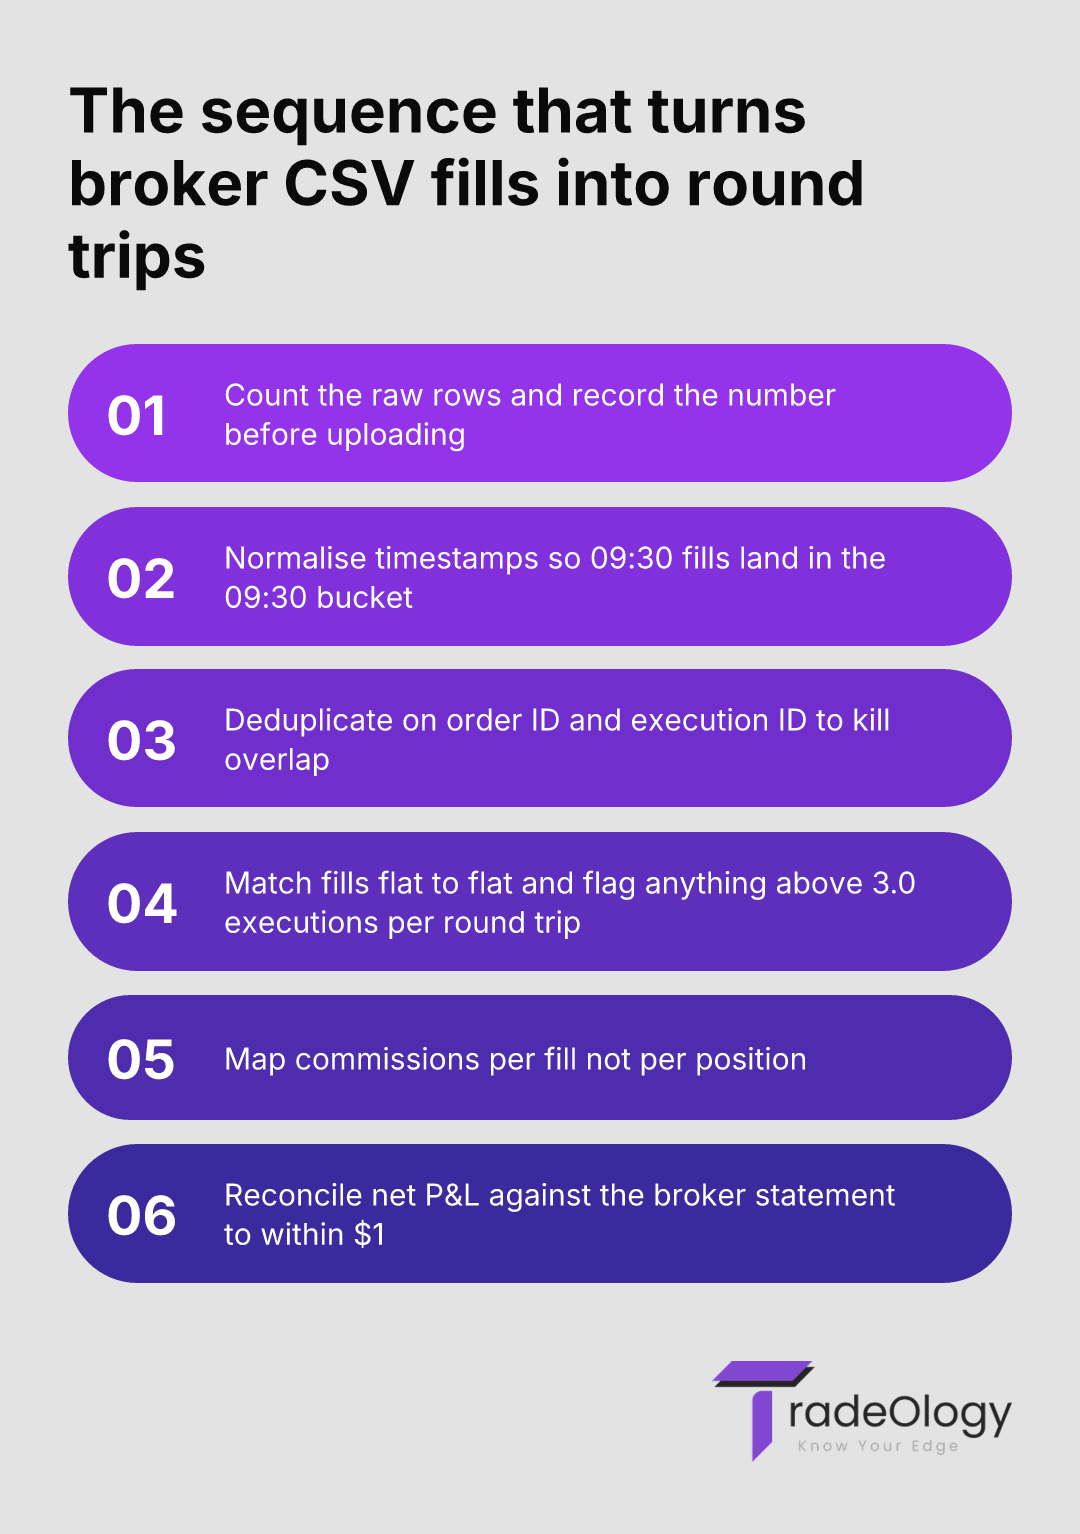
Do this in order. Skipping step two is how traders end up cutting a profitable hour out of their playbook.
Count the rows in the raw file and write the number down before you upload anything.
Normalise every timestamp to the timezone you actually trade in, then confirm your 09:30 opening-range fills land in the 09:30 bucket and not 08:30.
Deduplicate on order ID and execution ID, because partial-fill reports and end-of-day summaries overlap in most broker exports.
Match fills into round trips flat-to-flat, then check executions per round trip and investigate anything above 3.0.
Reconcile net matched P&L against the broker statement to within $1, including the commission and fee columns.
The reconciliation step is not bookkeeping. It is the only evidence that the analytics you are about to trust describe the account you actually traded. A journal that disagrees with the statement by $400 is a record of your intentions, not your results.
What each number is telling you after the import
Metric | What it actually means | Action to take |
|---|---|---|
Executions per round trip > 3.0 | Your reported win rate is a matching artefact, not a skill measure. | Judge the month on profit factor and expectancy per round trip instead. |
Profit factor differs between two imports | Fills were duplicated or dropped during the import. | Re-run the row count and dedupe on execution ID before reviewing anything. |
Journal P&L > statement P&L | The commission and exchange fee columns were never mapped. | Map fees per fill, not per round trip, and re-check expectancy. |
Hour-of-day peak sitting one bucket early | Timestamps imported in exchange time rather than your local session time. | Re-normalise timestamps before you cut any hour from your playbook. |
Average win under 1.2x average loss with 60%+ win rate | Partial exits are being counted as standalone round trips. | Re-match flat-to-flat and recalculate R-multiples on the full position. |
One month, one file, two completely different traders
A futures trader running a $50,000 account, risking 1% or $500 per position on MNQ, exported a month of activity: 312 execution rows. Dropped into a spreadsheet as-is, the file showed a 68% win rate, an average win of $214, and net profit of $1,180.
Matched flat-to-flat, those 312 fills became 118 round trips — 2.64 executions each. Real win rate: 47%. Average win: $486. Average loss: $362. Profit factor came out at 1.21 under both readings, which confirmed the file was intact and nothing had been lost in translation.
The commission column, ignored in the first pass, carried $0.74 per fill. Across 312 fills that is $231, turning $1,180 gross into $949 net. Expectancy per round trip fell from a fantasy 0.29R to a real 0.16R. Nothing about his trading changed between the two versions. Only the arithmetic did — and the second version is the one he had to size against.
The useful finding came from the round-trip view. His scaled exits clustered in the first 40 minutes, and the runners he left on after 10:15 gave back 0.4R on average. That pattern is invisible in a fill-level file, because the fills never know they belong to each other. It only appears once you can filter completed round trips by hold time and session.
Import the same CSV twice under two different matching rules: if profit factor moves by more than 0.02 you have duplicate or missing fills, and if only win rate moves — even by 20 points — your data is fine and your win rate was never the metric worth defending.
Where imports actually break
Merging two overlapping exports. Pulling last month and this month with a shared date creates duplicate fills, which quietly lifts profit factor and hides a bad week.
Treating a same-symbol re-entry as one position. If you go flat and re-enter within 90 seconds, that is two round trips with two decisions and two R-multiples.
Mapping fees to the round trip instead of the fill. A 6-fill position costs six commissions. Charging one understates cost by more than 80% on that trade.
Importing options by contract symbol without the multiplier. A $2.40 fill on 10 contracts is $2,400 of exposure, not $24, and expectancy in R collapses if the denominator is wrong.
Tagging setups before matching. Tags applied to fills scatter across partials, so the setup breakdown you build later is averaging fragments.
Where TradeOlogy sits in this
Broker sync removes most of the failure points above by pulling executions directly, deduplicating on execution ID and matching flat-to-flat before you see a single statistic. CSV import does the same work when your broker has no API, and the fill-level trade-offs between the two are covered in the fill-level comparison.
What matters after the import is what you can do with a clean round-trip table across stocks, options, futures and crypto in one account: expectancy by setup tag, profit factor by session, win rate by hour, and a drawdown curve built from positions rather than fragments. Trade reconciliation against the broker statement runs on every import, so the number in the journal is the number in the account. The free trial requires a card and you can cancel anytime.
FAQ
Why does my win rate change when I re-import the same broker CSV?
Because the matching rule changed, not the data. FIFO closes the oldest lot first and weighted-average treats the position as a single blended entry, which splits partial exits differently. Check profit factor: if it held steady, the file is intact and only the grouping moved.
Should I match fills FIFO or by weighted average price?
Weighted average tracks how most discretionary traders think about a position, since one entry decision and one exit plan become one round trip. FIFO aligns with the default cost-basis convention for tax reporting. Pick one and lock it, because switching mid-year breaks every month-over-month expectancy comparison.
How do I handle a futures position that spans two CSV exports?
Export with an overlap of at least one full session and let the importer dedupe on execution ID. An open position at the file boundary has no closing fill, so it should sit as an unmatched leg rather than being force-closed at the last price. Force-closing it fabricates a round trip and distorts your expectancy calculation for the whole period.
Does broker sync remove the need for trade reconciliation?
No. Sync removes manual mapping errors, but corrected fills, give-ups and post-settlement fee adjustments still arrive after the fact. Compare net P&L against the statement monthly and flag any gap over $1.
Import broker CSV trades once, then stop touching the file
The standard is simple and testable. Row count recorded, timestamps normalised, duplicates removed, one matching rule locked, net P&L reconciled to within $1 of the statement. Anything below that and every downstream number — expectancy, profit factor, the setup-level breakdown you plan to size against — is built on a file you never verified.
Verdict: when you import broker CSV trades, you are not importing trades at all — you are importing fills, and the matching rule you choose decides your win rate while leaving profit factor untouched. Reconcile to the statement, lock the rule, and judge the month on expectancy per round trip rather than a win rate that partial exits inflated by 20 points.