

Your Dashboard is a Mirror, Not a Map
Your equity curve goes up, then it gives half of it back. You close a +4R winner on Tuesday and bleed it out with five small losses by Thursday. You think the problem is your psychology, or maybe the choppy market conditions in 2026. You are wrong. The problem is you are making decisions based on the most misleading metric in your entire arsenal: your net P&L.
You mistake looking at a chart for doing analysis. You see a green number on your trading platform and assume you did something right. You see a red one and promise to be more disciplined next time. This is not analysis. It is financial voyeurism. Real improvement comes from using dedicated trade analysis tools, not just admiring the scoreboard your broker provides. Your brokerage statement is an accounting document, not a performance review. Using it to judge your trading is like using a bank statement to judge your diet. It tells you the cost, not the cause.
That Is Not The Real Problem. This Is.
Most traders believe their platform’s built-in dashboard is sufficient. They see a win rate, a P&L chart, and maybe a breakdown by instrument. They believe if they just find a strategy with a higher win rate, their problems are solved. This is why their results are unstable.
The consequence is you cannot distinguish between a high-quality loss and a low-quality win. A lucky trade that reinforces a bad habit is more dangerous than a well-executed trade that hits its stop. The P&L number does not show this distinction. You end up repeating career-ending mistakes because they sometimes result in a winning trade. You are reinforcing the very behaviors that create massive, account-crippling drawdowns. Your process has a hole, and your P&L is hiding the leak.
Stop Looking at P&L. Start Measuring Process.
The goal is to move from an outcome-based review to a process-based review. The question is not “Did I make money?” The question is “Did I follow my validated plan?” This requires a completely different set of metrics that your platform does not show you.
This is where your system breaks. You have no data on your execution quality. You have no quantifiable measure of your discipline. You need to track metrics like:
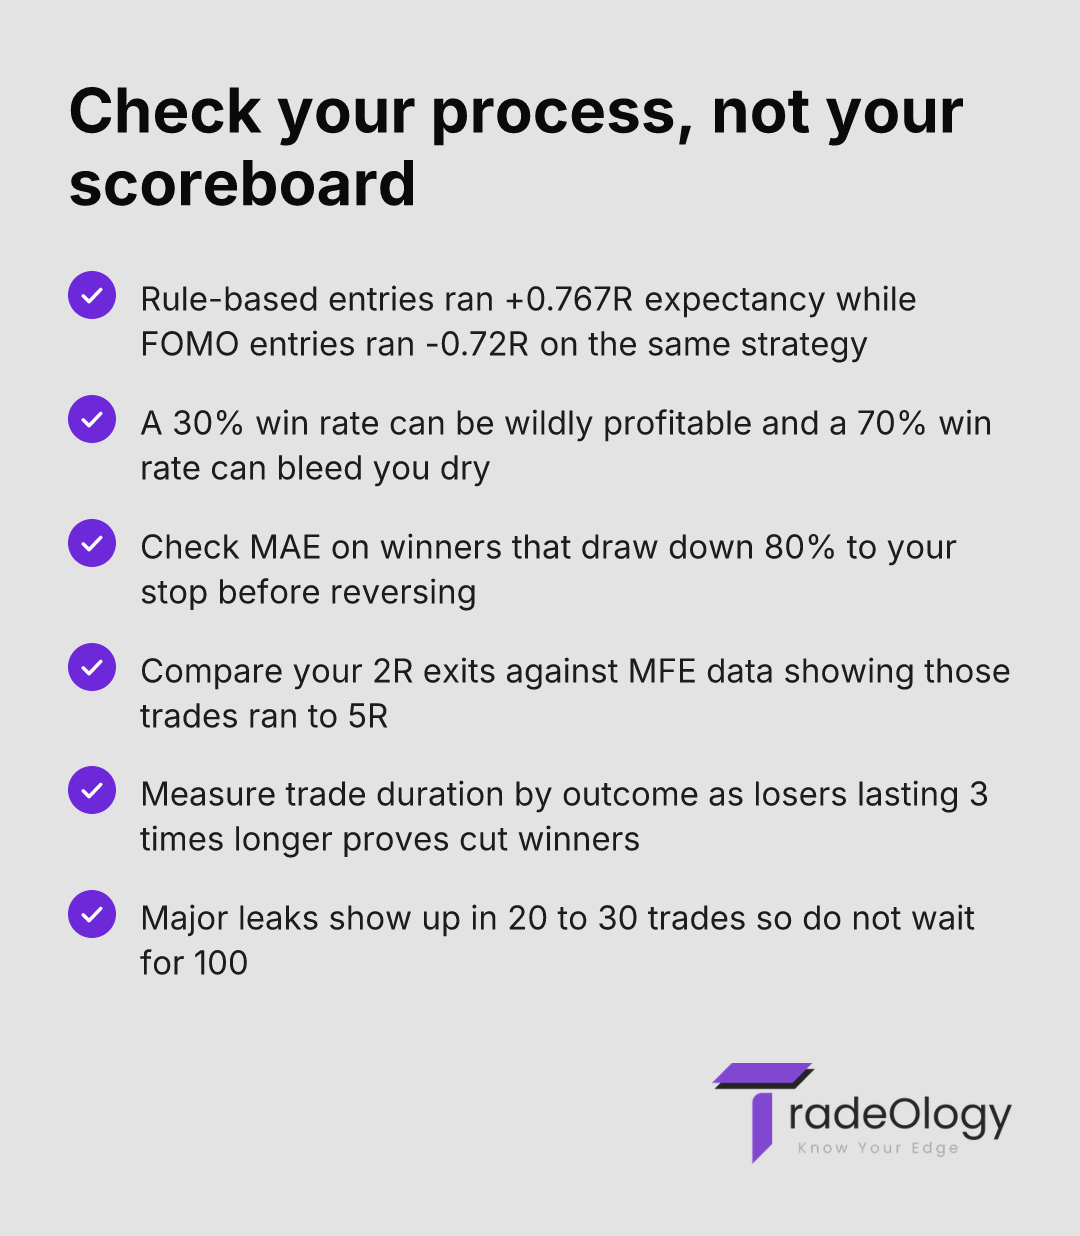
Expectancy: The final word on profitability. A strategy with a 30% win rate can be wildly profitable, while a 70% win rate strategy can bleed you dry. If you are not building your strategy around positive expectancy, you are just gambling. You need to know the expectancy of every single setup in your playbook. Read more on why win rate doesn't matter and expectancy does.
Maximum Adverse Excursion (MAE) & Maximum Favorable Excursion (MFE): MAE shows you how far your trades move against you. If you notice your winning trades consistently draw down 80% to your stop before reversing, your stop might be too tight. MFE shows the peak profit a trade reached. If you are consistently taking 2R profits when the MFE data shows the trades run to 5R, you are leaving a fortune on the table.
Trade Duration by Outcome: How long do your winning trades last compared to your losing trades? If your losers last, on average, three times longer than your winners, it proves you are giving losing trades too much room and cutting winners too soon. The data makes the emotional mistake impossible to ignore.
This is not optional. This is the foundation of serious statistical analysis in trading. Without it, you are just guessing.
How to Actually Use Trade Analysis Tools
You think you fixed this. You did not. A fancy dashboard does not fix a broken process. Better review does. This is how you systematically find your bleeding points.
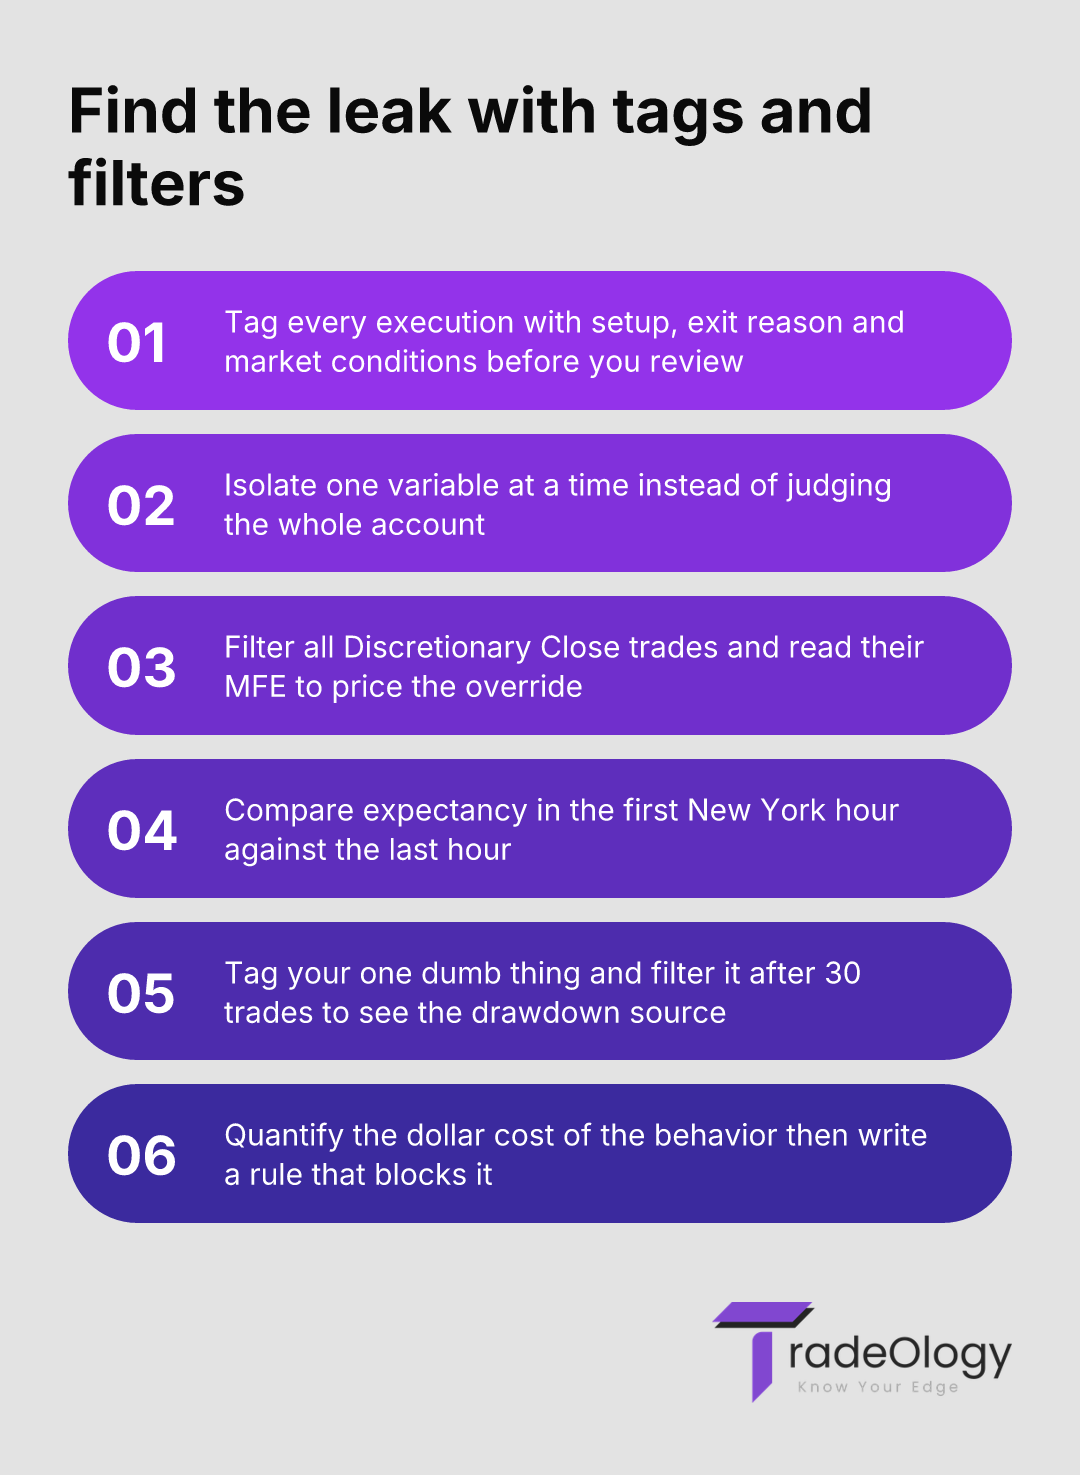
Tag Every Execution, Without Fail. This is the most critical step. Your software cannot analyze what you do not record. Every trade must be tagged with variables beyond the instrument name. What was the entry setup? What was the reason for exiting (e.g., "Target 1 Hit," "Stopped Out," "Time-Based Exit," "Discretionary Panic Close")? What were the market conditions? Be brutally honest.
Isolate One Variable. The power of real analysis comes from filtering. You are looking for patterns in the noise. Ask specific questions and use data to get an answer, not a feeling.
Run These Filters Now:
Filter 1: Exit Reason. Create a filter for all trades where the exit reason was "Discretionary Close." Now look at the MFE for those trades. The data will show you exactly how much money you left on the table by overriding your plan. This number is often shocking.
Filter 2: Time of Day. Compare the expectancy of your strategy during the first hour of the New York session versus the last hour. You may discover your edge is sharpest during specific windows and disappears entirely at other times.
Filter 3: Your "One Dumb Thing." Every trader has one. Impulsive entries. Widening stops. Taking a setup that doesn't meet all the criteria. Create a specific tag for it. After 30 trades, filter for that tag. The data will prove why that "one dumb thing" is the primary source of your drawdowns.
This is how you get better. You isolate a destructive behavior, quantify its dollar cost, and build a rule to prevent it. A clear, data-driven process is the only path to consistency. You can get a deeper look at this workflow in our guide to mastering the trade review process.
A Real-World Example: Where the Account Bleeds
A trader is managing a $100,000 account. He risks 1% ($1,000) per trade. His P&L has been choppy and flat for a quarter, despite feeling like he has a solid grasp on his breakout strategy.
He thinks the strategy is failing. It is not. His execution is.
Using a proper journal, he tags every trade as either a "Rule-Based Entry" or a "FOMO Entry" (e.g., chasing a move that already broke out). After 50 trades, he runs the numbers.
Rule-Based Entries (35 trades):
Win Rate: 57%
Average Win: +2.1R (+$2,100)
Average Loss: -1R (-$1,000)
Expectancy: (0.57 * 2.1) - (0.43 * 1) = +0.767R. These are highly profitable.
FOMO Entries (15 trades):
Win Rate: 40%
Average Win: +0.9R (+$900)
Average Loss: -1.8R (-$1,800)
Expectancy: (0.40 * 0.9) - (0.60 * 1.8) = -0.72R. These are account killers.
The realization is immediate and brutal. The "strategy" is not the problem. A single, identifiable, and fixable behavior is wiping out all the gains from his disciplined trading. His P&L was flat not because the market was difficult, but because his disciplined self was in a direct tug-of-war with his impulsive self. The data ends the debate.
Common Mistakes You Are Still Making
You already know this stuff. You are just not doing it with enough precision.
Mistaking a Broker Report for Analysis: Your broker report is for taxes. It has no context on MAE, MFE, entry/exit reasons, or setup performance. It is useless for performance improvement.
Ignoring Your Outliers: Do not discard that one massive losing trade as a "fluke." That outlier is the key. It reveals a weakness in your risk management or psychological resilience under pressure. Analyze it until you understand the conditions that created it.
Treating Backtesting as Gospel: A good backtest proves a concept. Good forward-testing in a live market proves a strategy. Your live results include slippage, commissions, and emotional errors. Your backtest is often a lie because it ignores the reality of execution.
Inconsistent Data Tagging: If your tagging is sloppy or emotional, your analysis will be worthless. Garbage in, garbage out. The process must be mechanical.
How TradeOlogy Forces Discipline
A tool does not make you profitable. A better process does. The purpose of a tool like TradeOlogy is to make a professional review process non-negotiable and efficient.
Instead of spending hours wrestling with a spreadsheet, you focus on the decisions. TradeOlogy automates the import from your trading platform, calculates over 70 metrics including the ones that matter (like expectancy and MFE/MAE), and gives you the powerful filtering needed to run the analysis we just discussed.
You can create custom tags and rules to instantly see the financial damage of your "FOMO Entries" or "Early Exits." The platform doesn't have an opinion. It just shows you the numbers. It forces an honest conversation that is impossible to have when you’re just staring at a P&L chart. It is a machine for implementing advanced trading analytics without needing a degree in data science.
FAQ
Aren't technical analysis indicators themselves trade analysis tools?
No. Indicators like RSI, moving averages, or MACD are for market analysis—they help you generate or qualify a trade idea. Trade analysis tools are for performance analysis—they evaluate your decisions and results based on your execution data after the trade is closed. One looks at the market; the other looks in the mirror.
How many trades do I need for the data to be valid?
Fewer than you think. While true statistical significance requires a large data set, major leaks in your process become visible with as few as 20-30 trades for a specific setup. If you have a behavior that is consistently costing you money, it will show up fast. Do not wait for 100 trades to start your review.
Can't I just do all this in an Excel spreadsheet?
You can, and it is better than nothing. But you will spend more time building formulas, debugging VLOOKUPs, and manually entering data than you will analyzing your performance. The goal is to be a trader, not a part-time spreadsheet developer. Dedicated tools automate the data collection and calculation, so you can spend your time on what matters: making better decisions.
The Final, Uncomfortable Truth
Your trading platform gives you a scoreboard. Your brokerage report gives you a tax document. Neither of these make you a better trader. Only a rigorous, data-driven review process will. In 2026, with markets moving faster than ever, you cannot afford to guess where your edge is or where your money is draining away.
The question is not whether you have access to data. The question is whether you have the discipline to use proper trade analysis tools to force an honest conversation with yourself. Stop looking at your P&L for answers. Start looking at your process for facts.