

You Bought the Wrong Thing
You paid for a data dump. You have a dashboard full of colorful charts, P&L calendars, and a firehose of analytics. And your equity curve still looks like a series of failed breakout attempts. You did not buy a solution. You bought a more expensive way to record the same mistakes.
Most traders treat their trading journal software like a digital scrapbook. It’s a passive record of what happened. A clean, searchable log of wins and losses. That is its most useless function. Its real job is not to store data but to expose the patterns that are draining your account. If your journal is not making you uncomfortable, it is not working.
Your results are not random. They are the output of a system. Not just your technical system for entries and exits, but your internal system. The one that decides to take an unplanned trade, move a stop loss on a whim, or oversize after a big win. That is the system your software must expose.
This Is Where Your Process Has a Hole
You believe more data equals more clarity. This is a lie traders tell themselves to feel productive. You spend hours tagging trades, uploading screenshots, and filling out dozens of custom fields. You track the weather, the day of the week, your mood—anything the software allows you to track. The result is a massive, unmanageable database that gives you the illusion of control while your performance stagnates.
The consequence is analysis paralysis. You have so many data points that you can justify any outcome. A losing trade? "Ah, Mercury was in retrograde, my stats show I’m weak on Wednesdays." A winning trade? You attribute it to the one metric that looks good and ignore the ten that show you got lucky.
This is not analysis. It is confirmation bias with extra steps. You are using your investment tracking tool to protect your ego, not to challenge your execution. The hole in your process isn't a lack of data; it's a complete lack of confrontational, objective review. You are bleeding money, and your journal is helping you write a nice story about it.
Stop Tracking Everything. Start Filtering Aggressively.
Clarity does not come from more data. It comes from less. It comes from targeted, aggressive filtering that isolates your single biggest point of failure. Your P&L is not one monolithic number. It is the sum of thousands of decisions. Your job is to find the decisions that cost the most.
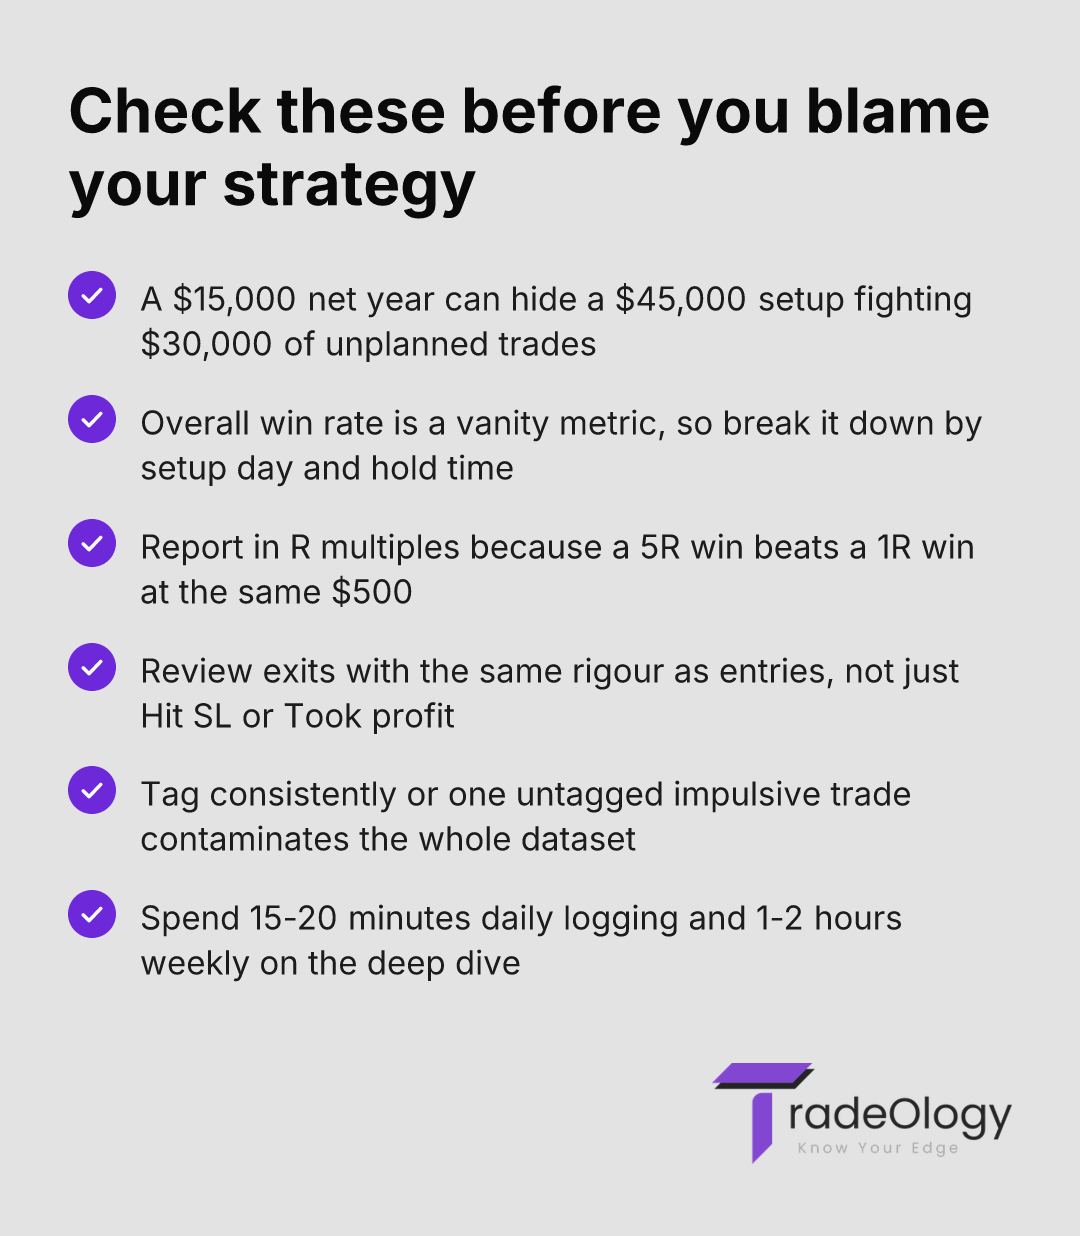
Stop looking at your overall win rate. It is a vanity metric. What is your win rate on Mondays? What is it for trades you hold for less than 10 minutes? What is it for your "A+" setups versus your impulsive "FOMO" trades? This is where the real work is done. A powerful trading journal is a crucial tool precisely because it can answer these questions, but only if you ask them.
Your review process should feel like an interrogation. You are looking for the weakest link, and you cannot find it by looking at the whole chain. You must isolate each link and test it under pressure.
The Filter-Down Review Process
This is not a passive review. It is an active hunt. You start broad and narrow down until you have a specific, actionable problem cornered. This is how you use your trading journal software to make money.
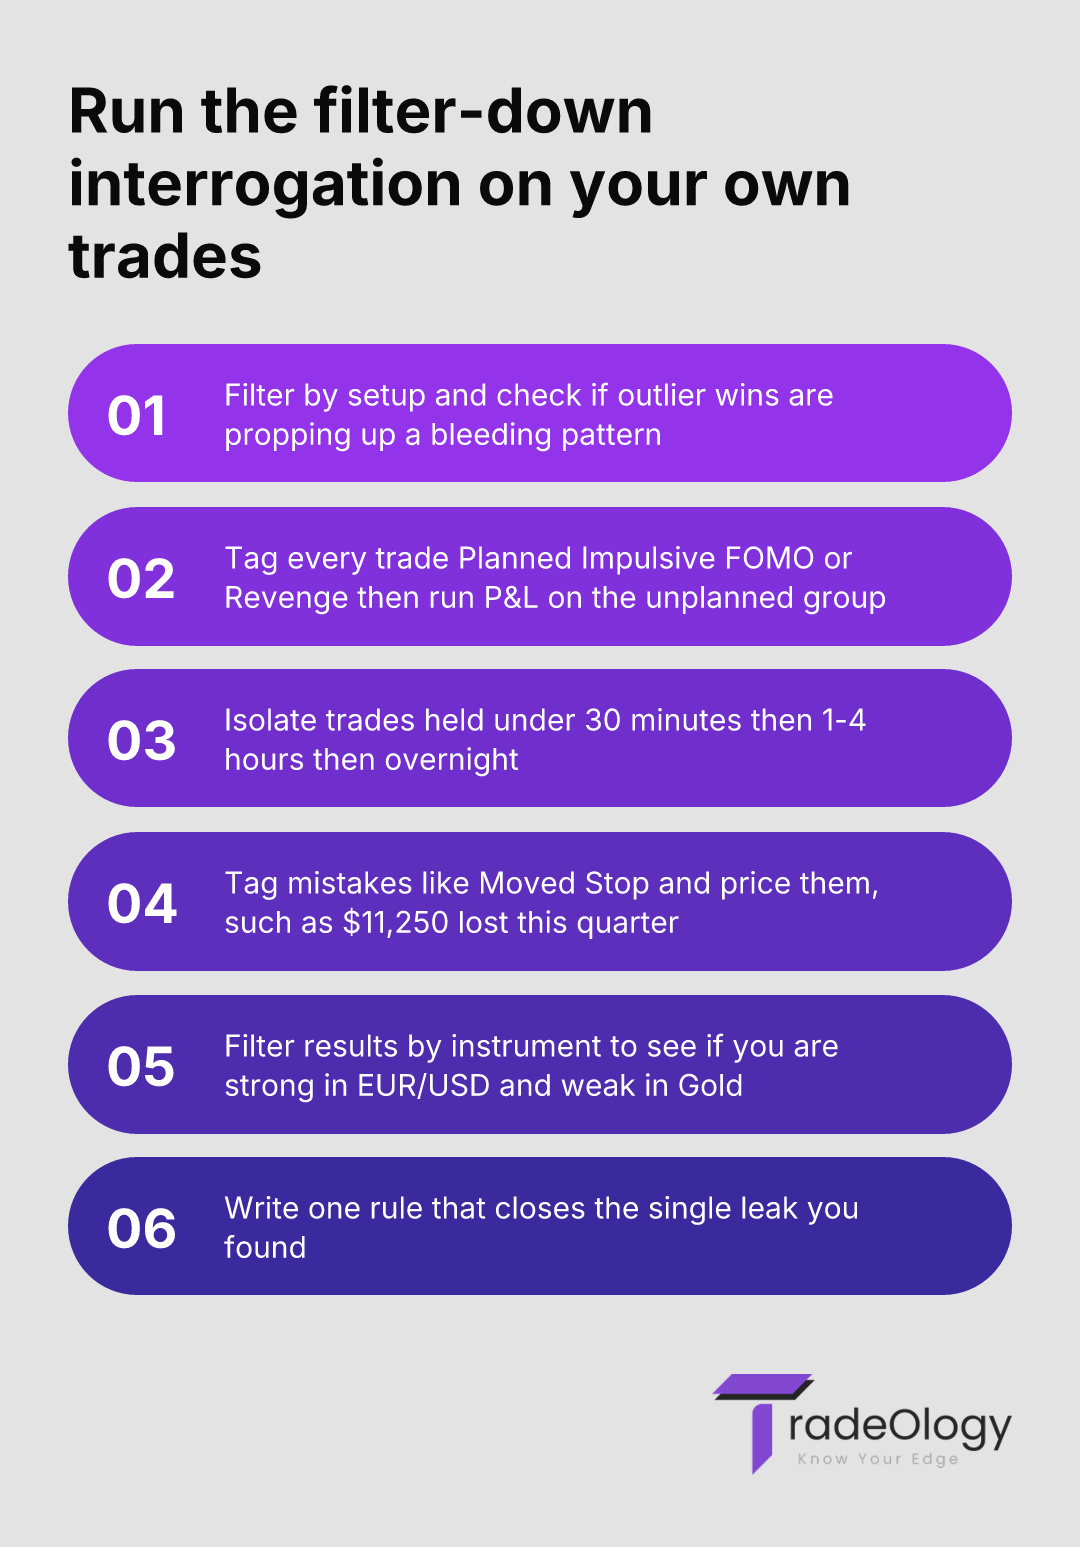
Filter by Setup: Run a report for each of your primary trading setups. Do not lump them together. Is "Setup A" actually profitable, or is it being propped up by a few outlier wins while the rest are small losses that bleed you dry? What is the real trading expectancy of each pattern?
Filter by Emotion/Discipline: You must tag your trades by psychological state. "Planned," "Impulsive," "FOMO," "Revenge." Now, filter for everything that wasn't a planned trade according to your system. What is the P&L of that group? For most traders, this number is a brutal wake-up call. It reveals the cost of discretionary versus systematic execution.
Filter by Duration: Isolate trades held for under 30 minutes. Then 1-4 hours. Then overnight. Where are you most profitable? Many traders discover they are brilliant scalpers but terrible swing traders, yet they keep trying to force longer-term holds because they think that's where "real money" is made. The data says otherwise. Stop doing what doesn't work.
Filter by Mistake: Tag your mistakes. "Moved Stop," "Sized Incorrectly," "Exited Too Early," "Forced Entry." Run a P&L report on each mistake. See the dollar cost of your impatience or greed. This transforms a vague feeling of "I need more discipline" into "Moving my stop has cost me $11,250 this quarter." That is specific. That is painful. That drives change.
A Real-World Example: The "Profitability" Illusion
A trader has a $100,000 account. Their journal shows a net profit of $15,000 for the year. The dashboard looks green. The equity curve is trending up. They feel successful.
Then they run the filter-down process. They isolate their primary setup: "Breakout/Retest." The total P&L for these trades is +$45,000.
This is where most traders stop, pat themselves on the back, and move on. That is where the damage starts.
The trader digs deeper. They create a new tag: "Unplanned Trades." These are the trades taken out of boredom, FOMO, or just a "feeling." They run the filter. The P&L for all "Unplanned Trades" is -$30,000.
The realization hits. Their core strategy is not just profitable; it's exceptionally effective. But its profits are being systematically destroyed by impulsive, undisciplined execution. The problem is not the strategy. The problem is the trader. The $15,000 profit is a lie. The real story is a $45,000 profit fighting a $30,000 loss. Without this filter, they would have spent the next year trying to "optimize" a strategy that was never broken, completely ignoring the behavior that was sinking the ship.
Common Mistakes You Are Making with Your Trader Tools
Your tools are only as sharp as the person using them. Here is how traders sabotage their own analysis:
Inconsistent Tagging: You tag trades for a week, then get lazy. Your data is now unreliable. An untagged impulsive trade gets lumped in with your planned trades, contaminating your entire dataset and hiding your mistakes.
Focusing on Entry, Ignoring Exit: Your journal is filled with notes about your entry signals, but your exit notes just say "Hit SL" or "Took profit." The exit is what realizes the P&L. Mastering the trade review process means analyzing your exits with the same rigor as your entries. Are you consistently giving back open profits? That's an exit problem.
Ignoring Instrument-Specific Performance: You assume your strategy works on everything. Does it? Filter your results by instrument. You might be a genius at trading EUR/USD but a disaster with Gold. The data will show this, but only if you look.
Not Calculating R-Multiple Expectancy: Looking at dollar P&L is misleading. An R-multiple report (your win/loss measured in units of your initial risk) standardizes performance. A trade that made $500 risking $100 (a 5R win) is far superior to one that made $500 risking $500 (a 1R win). Your journal must show you the quality of your wins, not just the size. This is directly tied to your position sizing and capital protection.
How TradeOlogy Forces a Better Review
This is not a sales pitch. It’s a reality check. The right online trading journal doesn’t just show you data; it structures your review. At TradeOlogy, we built our trading journal software around the filter-down process because it’s the only thing that works.
Our dashboard forces you to confront these numbers. You can create custom, multi-level tags to track not just setups but psychological triggers and execution errors side-by-side. Our filtering is not an afterthought; it’s the core of the platform.
You can instantly run a report that shows your P&L for "Setup A" specifically on "FOMO" days when you also "Moved Your Stop." The result is a number you cannot ignore. This is not about pretty charts. This is about delivering an unfiltered, sometimes brutal, reflection of your trading reality. The advanced trading analytics are designed for one purpose: to show you where your process leaks money, so you can fix it.
Frequently Asked Questions
1. How do I know if I'm over-analyzing or "paralysis by analysis?"
If your analysis does not lead to a specific, actionable change in your trading plan, it is useless. "I need to be more disciplined" is not an action. "I will not trade between 11 AM and 1 PM because my filtered results show a -$4,500 P&L during that window" is an action. Focus your review on finding one specific, fixable leak. Find it, write a rule to prevent it, and then move on.
2. How long should a trade review session take?
A daily review to log and tag trades should take 15-20 minutes. A weekly deep-dive review, using the filter-down method, should take 1-2 hours. This is not lost time; a two-hour review that stops you from making a recurring $500 mistake is the highest ROI activity you can perform. For an in-depth look at this, read our guide on common trading mistakes for more context.
3. My strategy seems to work and then it stops. How can a journal fix this?
Your journal will reveal if the strategy is the problem or if the market regime has changed. By tagging trades with market conditions (e.g., "Trending," "Ranging," "High Volatility"), you can filter your results and see if your strategy's performance has degraded only in the current environment. If your "Breakout" strategy is failing in a low-volatility range, the strategy isn’t broken; your application of it is wrong. The journal provides the data to make that distinction.
Your Software Is Not the Solution
Do not buy another piece of trading journal software hoping it will magically fix your discipline. It will not. A journal, whether it's TradeOlogy or a simple spreadsheet, is a mirror. If you refuse to look at the reflection, or you blame the mirror for what you see, you will never change.
The value is not in the data collection. It is in the aggressive, uncomfortable, and honest interrogation of that data. Stop admiring your wins and start dissecting your losses. Find the single most expensive pattern in your behavior and systematically eliminate it. That is the only path to stable, professional results.