

Crypto trading sessions are overlapping regional liquidity windows - Asian, European and US hours - that run without a close, which means the boundaries between them are defined by volume and funding settlement rather than by an exchange bell.
Every trader who moves from equities to BTC perps drags a 09:30-to-16:00 mental model into a market that never resets. Then the session tab in the journal starts producing contradictory answers. October says the Asian session is the problem. November says the US session is the problem. Nothing was fixed in between, so both readings cannot be true. The session breakdown that works on stocks is measuring the wrong boundary in crypto, and the trader keeps sizing up into a bucket that was never real.
The session map you imported from equities does not apply
An equity session works as an analytical unit because it has hard edges. Liquidity arrives at the open, an auction prints, and the tape stops. Overnight gaps are separate events. Bucketing by hour in that structure tells you something durable, because the same participants show up at the same time behind the same rules.
Crypto has none of that. Liquidity migrates rather than arrives. There is no auction, no consolidated print, and no forced flat. So when you tag a BTC trade as "Asian session", you are describing where the marginal volume sat, not what regime you traded. Two trades in the same bucket can be a thin 03:00 UTC drift and a violent liquidation cascade triggered by a US headline.
The consequence is measurable. Your hourly trade analysis fragments into 24 buckets with 8 or 12 trades each, and the standard deviation inside each bucket swamps the difference between them. You then act on a ranking that is statistically indistinguishable from random, cut your "worst hour", and discover next month that a different hour is now worst.
What actually anchors crypto trading sessions
Crypto does have periodic structure. It is just not the structure equities traders look for. Three anchors carry more signal than regional labels.
Funding settlement. Most perpetual venues settle funding every eight hours, at 00:00, 08:00 and 16:00 UTC. Positioning compresses into the minutes before each stamp and unwinds after it. That produces a repeatable widening of adverse excursion that no clock-hour bucket isolates cleanly.
Regulated futures hours. CME Bitcoin and Ether futures keep a defined schedule with a daily halt and a Friday settlement, and that schedule still shapes spot behaviour into 2026 as basis desks square up. The CME contract specifications give you the exact timestamps. The 22:00 UTC halt is a real edge in the tape, unlike "London close".
Weekend liquidity. Saturday and Sunday books are thinner. Spreads widen, depth thins, and the same 1% risk buys you a worse fill and a wider realised loss. Weekend is a session in crypto in a way that no weekday label is.
The anchor most traders never test
There is a fourth, and it is the one that usually explains the unstable hour report: your own continuous screen time. In a market that never closes, the trader is the only thing with a session. Sequence position inside a screen block — first trade, fourth trade, ninth trade — behaves far more consistently than clock hour, because it tracks decision quality rather than liquidity. If your hour report keeps rearranging itself, you are almost certainly looking at a fatigue curve wearing an hour label. The same decay shows up in equities, but the close forces a reset there. Crypto does not, which is why the hours where the edge dies run so much deeper.
Rebuilding the breakdown so it survives a second sample
This is the sequence that turns a noisy 24-bucket report into something you can size against.
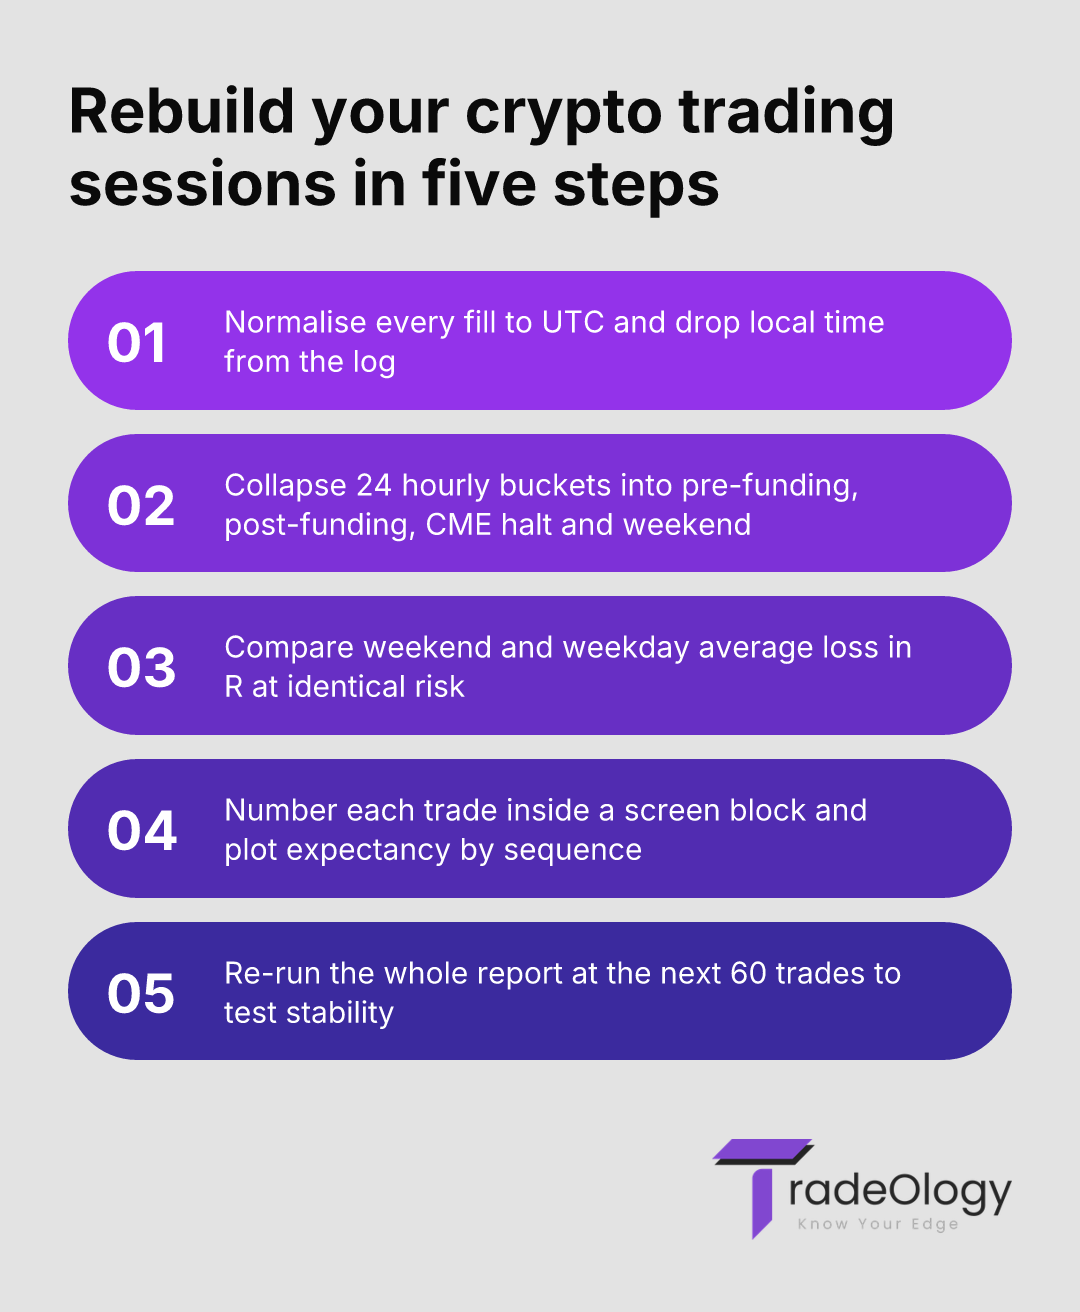
Normalise to UTC. Local-time tagging destroys comparability the moment daylight saving shifts or you travel. Every serious crypto record lives in UTC.
Collapse 24 hours into four regimes. Pre-funding, post-funding, CME halt window, and weekend. Four buckets with 50 trades each beat 24 buckets with 9.
Split weekday and weekend before comparing anything. Compare average loss in R, not dollars, so size changes do not contaminate the read.
Number trades within each screen block. Reset the counter after any break longer than 90 minutes. Plot expectancy by sequence number.
Re-run at the next 60 trades. A finding that survives two independent samples is a finding. One that moves is variance.
Setup checklist
Tag every crypto fill in UTC and record the funding window it sits in.
Calculate average MAE in R for the 30 minutes before each funding stamp.
Compare weekend and weekday average loss at identical risk per trade.
Analyze expectancy by trade sequence number, not by clock hour.
Eliminate any bucket from your decision-making until it holds 30 or more trades.
Metric | What it actually means | Action to take |
|---|---|---|
Worst hour bucket moves >3 hours between samples | Hour of day is noise in your data set. | Rebucket by funding window and trade sequence. |
Weekend win rate flat, average loss 1.4R vs 0.9R | A liquidity and slippage problem, not a setup problem. | Halve weekend size until average loss returns to 1.0R. |
MAE 1.6x wider on pre-funding entries | You are entering into positioning that is about to unwind. | Stop opening new risk 30 minutes before 00:00, 08:00 and 16:00 UTC. |
Expectancy negative from trade seven onward | Screen fatigue, since crypto never forces you flat. | Set a hard trade cap per block and log the stop. |
Profit factor 1.31 falling to 0.88 with win rate unchanged | Loss size expanded while hit rate held. | Fix stop placement and size, leave the entry alone. |
What 214 trades looked like after rebucketing
A trader running a $40,000 account, risking 1% or $400 per trade on BTC and ETH perps, logged 214 round trips over four months. His stock-style session report said the Asian session was the leak in January and the US session was the leak in February. Both months, he cut exposure to the flagged window and gained nothing.
The rebucketed data said something else. Aggregate win rate was 45% and barely moved across any clock hour. Profit factor, though, fell from 1.31 to 0.88 between the first and second halves of the sample, and expectancy went from +0.18R to -0.05R. Average win held near 1.7R. Average loss expanded from 0.9R to 1.4R.
Three buckets carried it. Weekend trades were 38% of his volume and 61% of his gross losses, at identical dollar risk. Entries placed inside the 30 minutes before a funding stamp showed MAE 1.6 times wider than his baseline, which meant stops that were correctly placed on paper were getting swept before the move resolved. And sequence analysis was brutally clean: trades one to three averaged +0.21R, trades four to six +0.02R, and trades seven onward -0.34R. Nothing in the hour-of-day view showed any of it, because his late-sequence trades were scattered across every hour on the clock.
If your worst-performing hour bucket moves more than three hours between two consecutive 60-trade samples, you are not measuring crypto liquidity — you are measuring how long you have been at the screen, and the fix is a trade cap, not a time filter.
He capped himself at five trades per block, cut weekend size to 0.5%, and blocked entries in the pre-funding window. Over the next 90 trades, win rate moved one point to 46%. Average loss came back to 1.0R. Profit factor recovered to 1.24. The entries never changed.

Mistakes that keep the session tab useless
Copying the equity session grid wholesale. Tokyo, London and New York labels on a 24-hour asset produce three buckets whose participants overlap by design, so differences between them rarely clear one standard deviation.
Reading 24 hourly buckets off 200 trades. Eight trades per bucket cannot separate skill from variance. Ranking them anyway is how traders delete their profitable hours.
Keeping local time in the log. A journal that mixes CET and CEST timestamps quietly shifts half your year by an hour, and every funding-window comparison breaks.
Treating weekend as just more weekday. Same size into 30-40% less depth is a slippage decision disguised as a setup decision.
Logging outcomes without logging session context. A record of fills and P&L is a trade log, and the difference between a log and a journal is exactly the context that makes session work possible.
Where TradeOlogy fits
The work above is mechanical, which is why doing it in a spreadsheet fails after about 100 trades. Connect an exchange account or import a CSV and TradeOlogy builds round trips from your executions, then breaks expectancy, profit factor, win rate and drawdown down by session and by hour automatically. Everything is timestamped consistently, so weekday and weekend comparisons stay honest.
The part that matters most for crypto is tagging. Tag your own regimes — pre-funding, post-funding, CME halt, weekend — then filter and compare them side by side instead of accepting a stock-market grid. The equity curve dip you thought belonged to the Asian session usually reappears attached to the sequence-heavy blocks, and the histogram bar where win rate drops under 40% turns out to sit in one weekend cluster. Same discipline as a structured review process, applied to a market that gives you no natural stopping point. The trial requires a card and you can cancel anytime.
FAQ
Do crypto trading sessions actually change volatility, or only volume?
Both, but the volume shift arrives first and the volatility follows it unevenly. Thinner books during weekend and late-Asian hours mean the same order size moves price further, which shows up in your data as wider MAE and larger average loss rather than a lower win rate. Measure it in R per trade, not in dollars.
How many trades do I need per bucket before hourly trade analysis means anything?
Treat 30 trades as a floor for a directional read and 50 as the point where you would change position size. Below 30, the confidence interval around expectancy is wider than the difference you are trying to detect. That is why collapsing 24 hourly buckets into four regime buckets gives you a usable answer far sooner.
Why does my profit factor fall while my win rate stays flat across sessions?
Because loss size, not hit rate, is doing the damage. A flat win rate with a falling profit factor almost always traces to stops being swept in thinner liquidity or to size that was set for weekday depth. Check average loss in R by weekday versus weekend before touching your entry criteria.
Should my crypto trading journal store fills in UTC or local time?
UTC, without exception. Funding stamps, CME schedules and exchange maintenance windows are all published in UTC, and daylight saving corrupts any local-time series twice a year. Store UTC and display local if you want, but never analyse in local.
Does the CME futures close still matter for spot crypto traders in 2026?
Yes, less than it did in 2021 but enough to keep in your bucketing. Basis and hedging flow around the daily halt and Friday settlement still produce repeatable behaviour in spot, and segmenting your analytics by that window costs nothing to test. Run it as one of your four regimes and let your own 60-trade samples decide.
The standard to hold yourself to
Any session finding you have not reproduced on a second independent sample is a hypothesis, and sizing up on a hypothesis is how a 1.31 profit factor turns into 0.88 without a single change to the setup. Delete the equity session grid from your crypto record this week and rebuild it around funding stamps, the CME halt, weekend liquidity and trade sequence.
Verdict: Crypto trading sessions are real, but not the ones stock traders import — the durable boundaries are funding settlement, the CME halt, weekend depth and your own screen time. Bucket by those four and the leak stops moving around your report every month.