

A crypto trading journal is a record of every crypto round trip - entry, exit, size, fees and funding - organised so performance can be measured by setup, by session and by hour instead of as one lump P&L figure. Most traders who build one go straight to the clock-hour histogram, find a red bar somewhere around 03:00 UTC, decide that thin liquidity is the villain, and stop looking. That conclusion is almost always wrong, and it costs more than the bad hour itself, because the real loss cluster sits in a variable that no exchange timestamp records: how long you had already been staring at the screen when you clicked.
Why the clock-hour histogram misleads crypto traders
Equity traders inherit a session from the exchange. Futures traders get a maintenance break - CME's bitcoin futures stop trading daily and hand you a natural line between one day's decisions and the next. Spot and perpetual crypto give you nothing. Sunday 04:00 looks identical to Wednesday 14:00 on the order book, so traders assume the only meaningful time variable is the clock.
Run the breakdown and you get a histogram that looks informative and is mostly noise. Twenty-four buckets across 180 trades leaves 7 or 8 trades per bar. One 4R winner in the 09:00 bucket flips it green. Two stopped-out longs in the 03:00 bucket flip it red. Then the trader writes a rule - "no trades before 06:00" - that was fitted to four executions.
The consequence is not just a useless rule. It is a false all-clear on every other hour. The trader now believes the problem is solved and keeps taking the trades that actually drained the account, because those trades are scattered evenly across the clock. That is the difference between a log and a journal, and it is the exact failure described in Trading Journal vs Trade Log Difference: recording data is not the same as isolating a variable.
The variable that actually separates your good hours from your bad ones
Tag every trade with the number of consecutive hours you had been at the desk when you took it. Trade one of the day is screen hour 1. A trade taken eleven hours after you sat down is screen hour 11. Nothing else changes — same setups, same instruments, same journal.
Now compare the two breakdowns. In every crypto book I have looked at where the trader logged both, the screen-hour spread was materially wider than the clock-hour spread, and it moved in one direction: expectancy decays after roughly screen hour 6, and turns negative somewhere between hour 8 and hour 10. The clock hour was a proxy. Screen hour is the cause.
This matters more in crypto than anywhere else. A stock trader physically cannot reach screen hour 12 inside a single session. A crypto trader reaches it on a Saturday without noticing, because there is no bell to argue with. The market's 24/7 structure does not create the edge decay — it removes the only thing that used to stop it.
Two supporting metrics tell you whether it is fatigue rather than setup quality. First, check whether win rate holds while average loss expands. Second, check trade frequency. Fatigue rarely lowers your hit rate; it widens your losses and raises your click count. If your late-session win rate is flat at 48% but average loss grew from 0.9R to 1.4R, you are not picking worse trades. You are managing them worse. That distinction decides whether you rewrite your entry rules or your schedule.
The audit, step by step
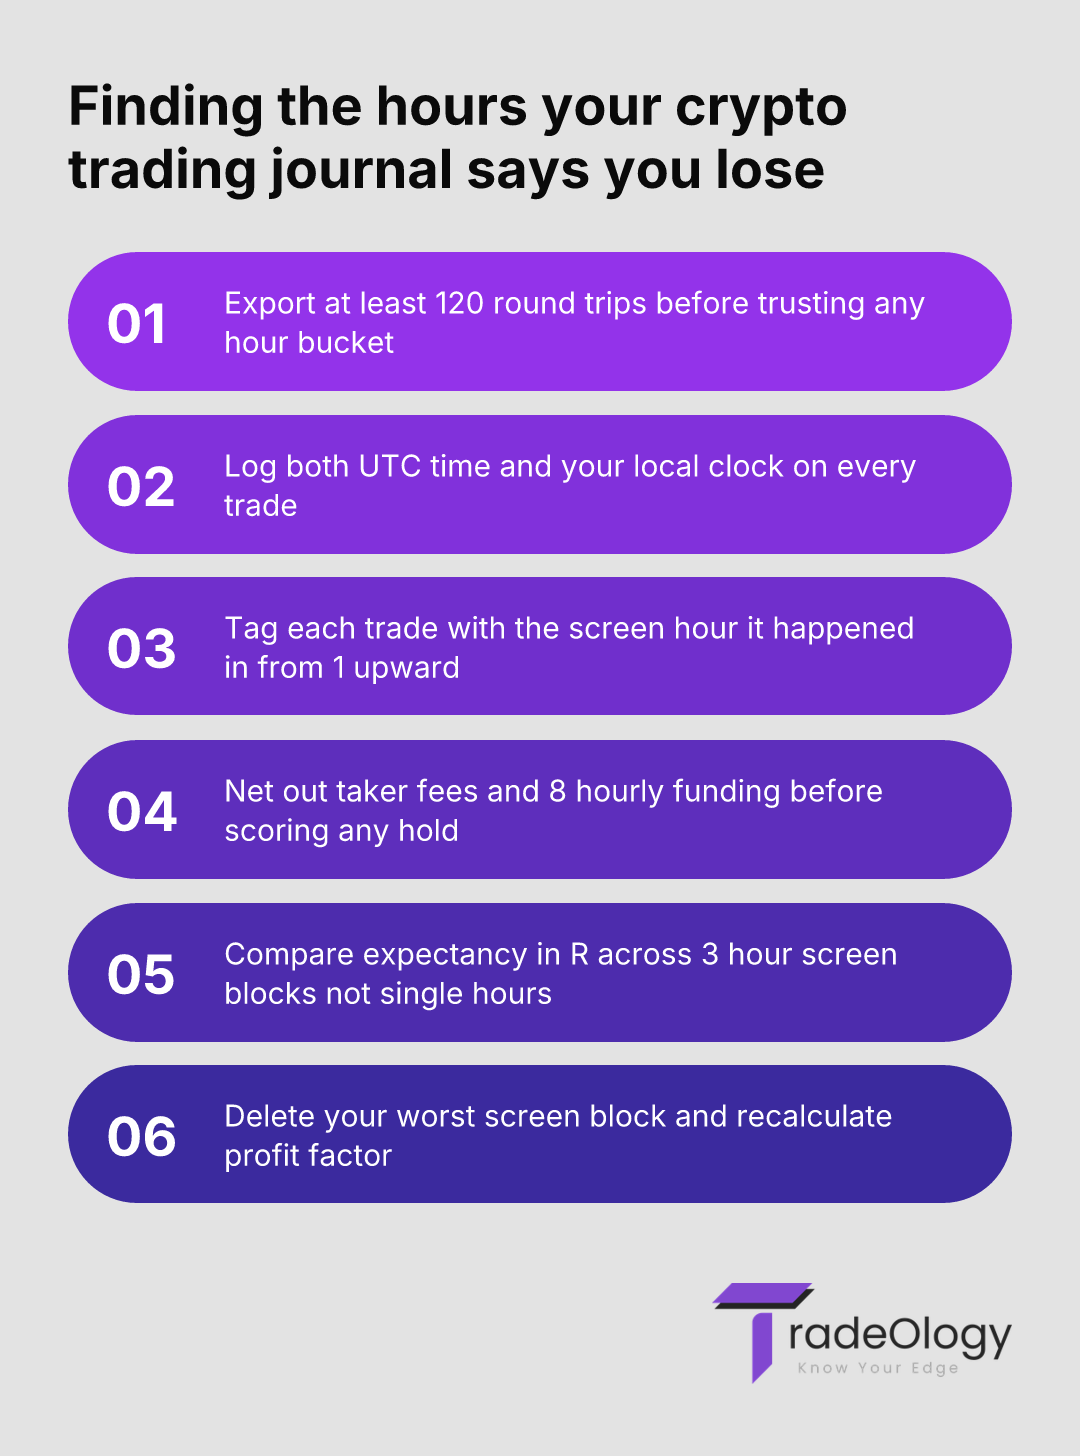
Export at least 120 round trips. Below that, every bucket is anecdote.
Add two timestamp columns: exchange time in UTC and your local clock. Crypto journals that store only UTC hide your sleep cycle.
Add a screen-hour column. Session starts when you open the platform, not when you take the first fill.
Net out costs properly. Taker fees, slippage and 8-hourly funding. A perp held three days at 0.01% per 8 hours and 5x leverage bleeds about 0.45% of equity before the chart moves.
Group into 4-hour blocks for clock time and 3-hour blocks for screen time. Compute expectancy in R, profit factor and average loss per block.
Delete your worst screen-hour block from the dataset and recalculate profit factor. The size of the jump is your answer.
Setup checklist
Tag every crypto round trip with the screen hour it occurred in, starting at 1.
Calculate expectancy in R for each 3-hour screen block, not for single hours.
Compare average loss early versus late in session to separate fatigue from bad entries.
Eliminate the block where expectancy crosses zero and re-run profit factor.
Review weekend trade count against weekday trade count at equal expectancy to catch boredom volume.
What each number is actually telling you
Metric | What it actually means | Action to take |
|---|---|---|
Clock-hour expectancy spread under 0.15R | Time of day is not your variable, or your sample is too thin to say. | Collapse into 4-hour blocks and test screen hour instead. |
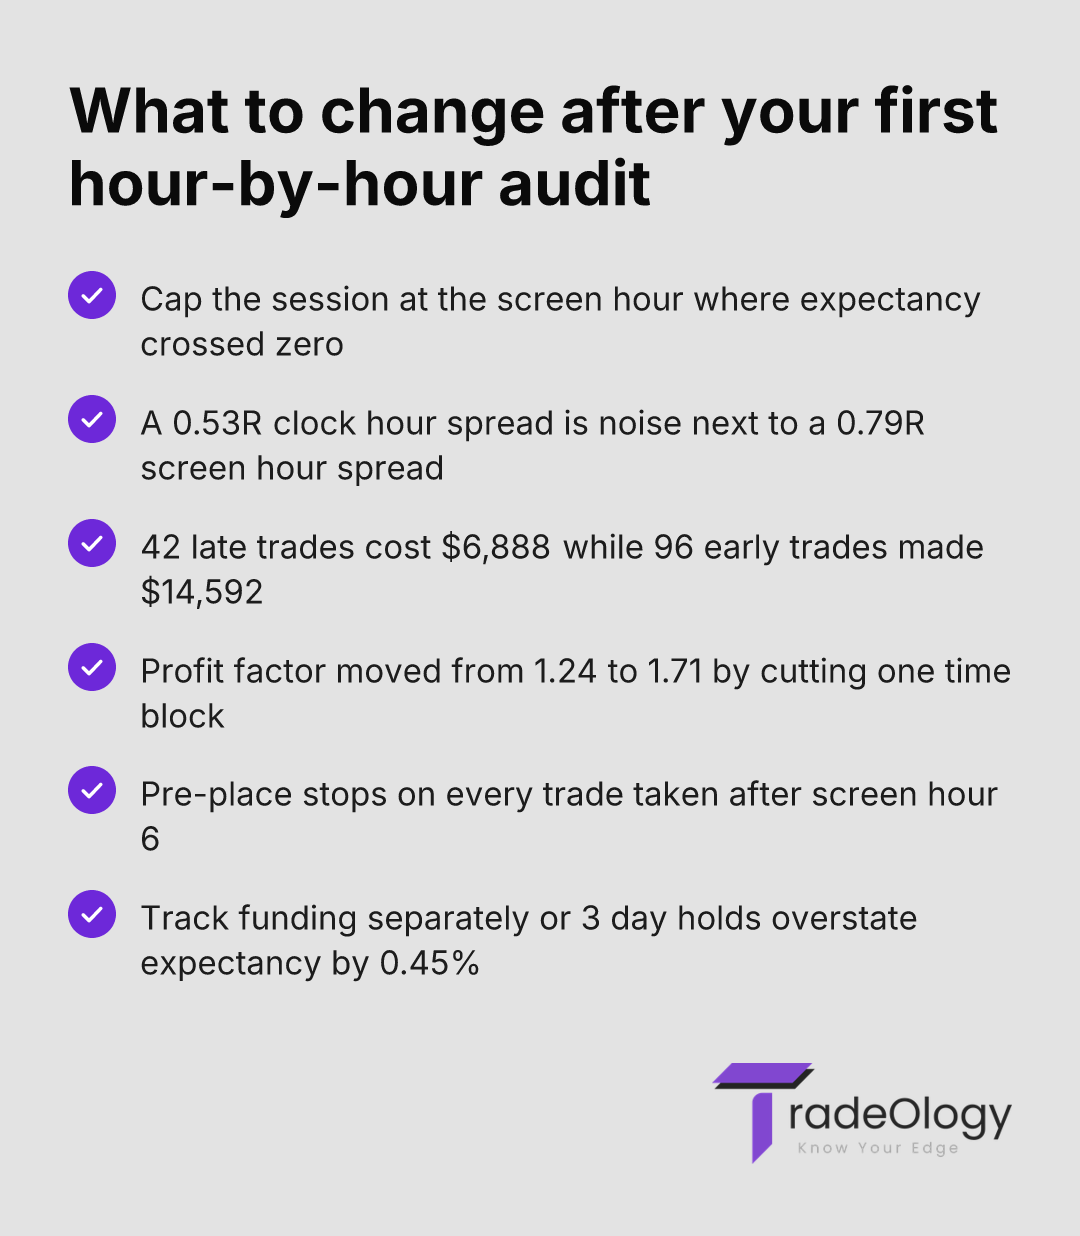
Profit factor 1.24 overall, 1.71 without the last screen block | Your setups work. Your stopping point does not. | Set a hard logout at the block boundary and hold it for 30 sessions. |
Flat win rate, average loss up 40% late in session | Entry selection is intact. Stop discipline is failing. | Pre-place stops at entry on any trade after screen hour 6. |
Weekend trade count 2x weekday at equal expectancy | You are paying fees and funding for activity, not edge. | Cap weekend trade count at your weekday average. |
Funding cost above 15% of gross profit | Your holding period, not your direction, is eating the book. | Shorten holds or move the setup to a spot position. |
A worked example: $40,000 crypto book, 180 trades, 90 days
The trader risks 1% per position — $400 — trading BTC and ETH perps on breakout continuation setups. Ninety days, 180 round trips, net result +$8,040. Profit factor 1.24. Win rate 47%. Good enough to feel fine about, weak enough that drawdowns hurt.
The clock-hour breakdown gave a worst bucket of 03:00–04:00 UTC at -0.22R average and a best bucket of 13:00–14:00 UTC at +0.31R. A 0.53R spread across 24 thinly populated bars. He had already written the "no early morning trades" rule based on it, and nothing improved.
The screen-hour breakdown was not close. Screen hours 1–5 held 96 trades averaging +0.38R, worth $14,592. Screen hours 6–8 held 42 trades at roughly +0.02R, essentially flat. Screen hours 9 and beyond held 42 trades averaging -0.41R, costing $6,888. That is a 0.79R spread on populated buckets, and it explains 86% of what the account gave back. Remove that final block and profit factor moves from 1.24 to 1.71 with no change to the strategy.
The behavioural detail sits in the average loss column. In hours 1–5 his average loss was 0.94R — he took his stops. After hour 9 it was 1.51R. Same setups, same size, wider bleed. He was not finding worse trades late; he was refusing to close the ones that went against him, because by hour 9 he was already down on the day and needed the position to come back. The equity curve shows it as a repeating late-session step down that recovers the next morning, which is why looking at daily P&L alone hid it for three months.
If deleting your final screen-hour block lifts profit factor by more than 0.3, you do not have a strategy problem — you have a stopping problem, and every hour you stay logged in past that point is priced at your average loss.
Mistakes that keep the pattern invisible
Storing timestamps in UTC only, which erases the relationship between your trades and your own sleep cycle.
Judging hours on P&L instead of R-multiple, so three oversized positions define an entire bucket.
Excluding funding and taker fees, which flatters every hold longer than 24 hours and inflates expectancy on your slowest setups.
Treating a 6-trade bucket as a finding. Under 20 trades per bucket, the standard deviation swamps the mean.
Counting screen time from your first fill rather than from platform open, which shifts every trade one or two buckets early.
Reviewing at the end of a losing session, when the same fatigue that produced the trades is now writing the notes. A Pro Trader's Guide to the Trading Journal covers why review timing changes what you find.
Where TradeOlogy does the work
Connect a brokerage account or import a CSV, and TradeOlogy turns raw crypto executions into round trips with expectancy, profit factor, win rate and drawdown attached — then breaks all of it down by setup, by session and by hour. That handles the hard part: reconstructing partial fills and scale-outs into one measurable trade so the hour-level numbers mean something.
The screen-hour layer is yours to add. Tag it as a custom label on each trade, then filter. Once the tag exists, you compare expectancy across blocks the same way you compare setups, and the 24/7 market analytics stop being a wall of timestamps and start showing where the decay begins. The free trial requires a card and you can cancel anytime — 90 days of history is enough to run this audit on day one. If you want the metric groundwork first, start with profit factor and what your analytics actually reveal.
FAQ
How many trades do I need before hour-of-day data in a crypto trade log is trustworthy?
Aim for at least 20 closed trades per bucket you intend to act on. With 180 trades across 24 clock hours you have 7 or 8 per bar, which is noise. Group into 4-hour blocks and the same sample gives you 30 per bucket, which is a signal you can size against.
Why does my crypto expectancy fall on weekends when volatility is often higher?
Because weekend volatility arrives with thinner books, so your stops fill worse while your setups trigger at the same rate. Check average loss and slippage per trade on Saturday and Sunday separately. If average loss expands more than 20% versus weekdays, the problem is execution cost, not direction.
Should a bitcoin trading journal track funding payments separately from realised P&L?
Yes, as its own column. Funding at 0.01% per 8 hours is 0.03% of notional per day, and at 5x leverage that is 0.15% of equity daily. Blend it into P&L and you can never tell whether a setup underperforms or simply gets held too long.
Does moving my trading to a different time zone fix a bad hour?
Rarely. If the loss cluster tracks screen hour rather than clock hour, relocating your session moves the red bar to a new clock position and changes nothing else. Test it by comparing the two breakdowns before you rearrange your day, then read how to properly evaluate a trading strategy before you rewrite rules.
How do I know the late-session losses are fatigue rather than a genuinely worse market regime?
Split your late trades by clock hour. If losses persist at the same screen hour across completely different clock hours and different days of the week, the market is not the common factor. The same test appears in futures journal work on sizing, where fatigue shows up as position drift instead.
Set the standard your crypto trading journal has to enforce
Pick the screen-hour block where expectancy crosses zero in your own data and treat that boundary as a risk limit, not a preference. Log out. Not "one more setup" — out. Then run the audit again after 30 sessions and check whether profit factor held its gain, because a rule you enforce for two weeks and abandon is worse than no rule, since it corrupts the next dataset too.
Verdict: A crypto trading journal that only breaks performance down by clock hour will hand you a fitted rule and a false all-clear. Tag screen hours instead, and in most books the last block of the session is the only thing standing between a 1.24 profit factor and a 1.71 one.