

Your Dashboard is Green, But Your Account is Leaking
Your monthly P&L is positive. Your win rate is north of 60%. From the surface, things look stable. But you are working harder to produce less, and you cannot pinpoint why. Your equity curve is jagged—a sharp gain followed by a string of frustrating, small losses that bleed you out. You end the month up, but you feel like you lost.
Your P&L is a lagging indicator of results. It is not an indicator of process. This is the single biggest blind spot for an intermediate trader. You have learned enough to be profitable, but you have not learned enough to distinguish luck from a durable edge. You need to stop looking at your P&L and start using real trading analytics to diagnose the health of your execution.
That Is Not the Real Problem. This Is.
You think the problem is your strategy. You start tweaking indicators, changing timeframes, or hunting for a new setup. You are wrong. The problem is not the strategy; it is the application of it. Your results are an average of your best discipline and your worst impulses, and the average is lying to you.
Your system is leaking, and you are trying to fix it by repainting the boat. The damage is happening below the waterline. You are celebrating a high win rate that is secretly funded by undisciplined losses. You are taking A+ setups and C- setups and pretending they belong in the same performance report. This is why your results feel unstable. They are.
What Actually Exposes the Leaks
You need to stop looking at vanity metrics and focus on data that reveals behavior. The answers are not in your gross P&L. They are in the granular data of your trades—data that most traders ignore because it is uncomfortable. Effective trade data analysis forces you to confront your habits.
These are the metrics that matter:
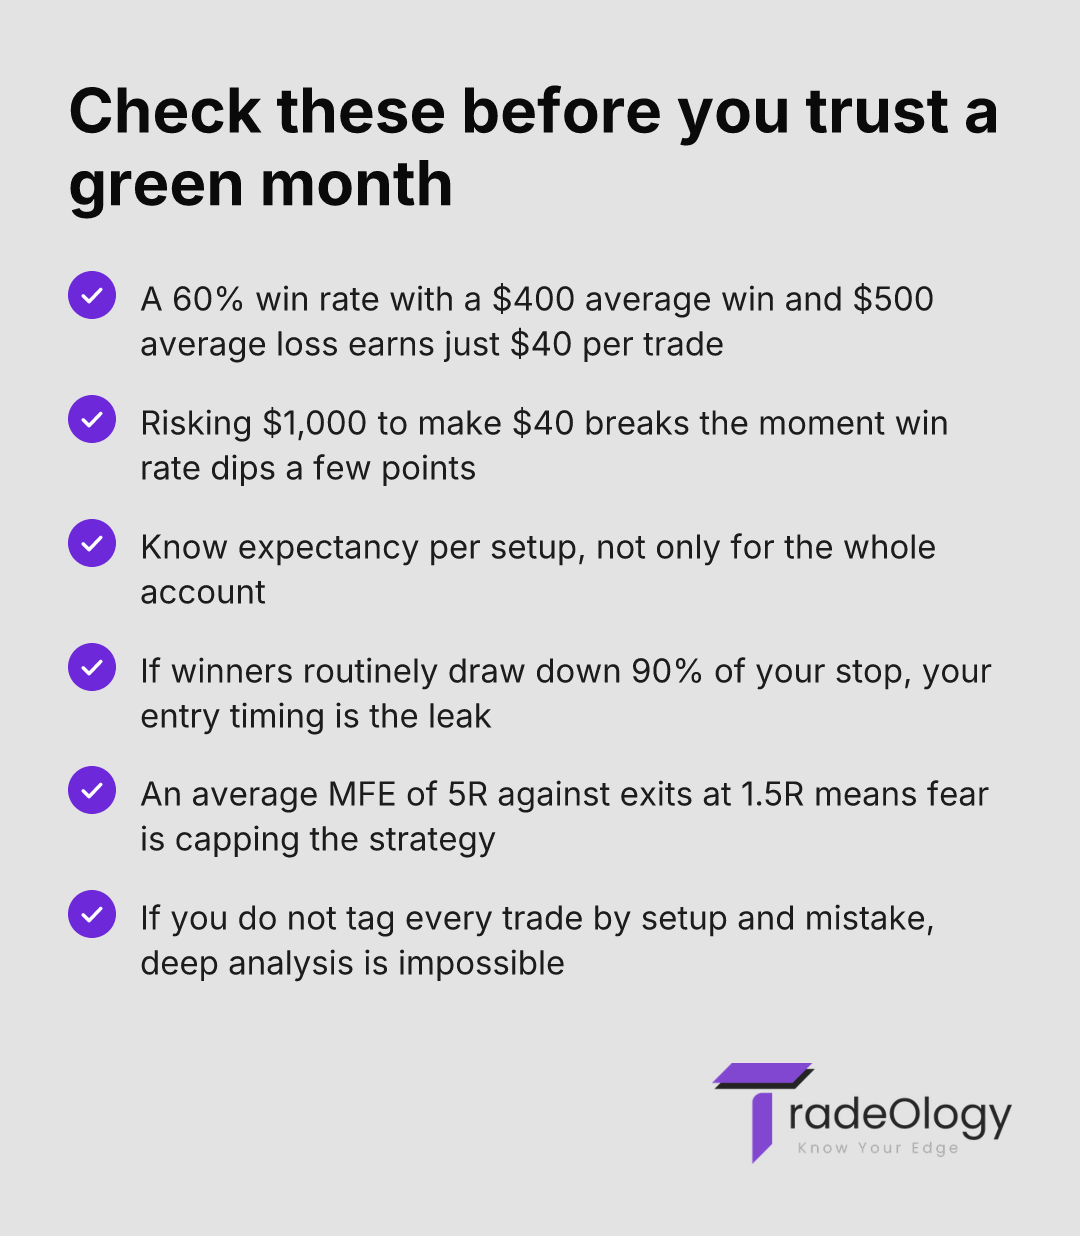
Expectancy: This is the only metric that balances your win rate against your risk-reward ratio. A positive expectancy proves you have a statistical edge. A negative or near-zero expectancy proves you are just gambling, even with a 70% win rate. You must know your expectancy per setup, not just for your whole account. Read our guide to trading expectancy and stop ignoring it.
Maximum Adverse Excursion (MAE): MAE shows the biggest drawdown your trade experienced before becoming a winner. If your winning trades consistently draw down 90% of your stop-loss distance, your entry timing is imprecise. Your stop is correct, but your entry is costing you.
Maximum Favorable Excursion (MFE): MFE shows how much profit you left on the table. If your average MFE on winning trades is 5R, but you are consistently taking profit at 1.5R, your fear is capping your performance. The strategy is better than your discipline allows.
Performance by Setup Tag: If you are not tagging every trade with the precise setup used, you are flying blind. Your "Reversal" strategy might be a consistent loser that is being subsidized by your highly profitable "Breakout" strategy. Your overall P&L hides this. Stop averaging them.
A Better Review Process: Surgical, Not Superficial
You think you have a review process. You look at your wins and losses, maybe write a few notes in your trading journal, and call it a day. That is not a review. That is a glance. A real review is an interrogation of your data. This is how you find your edge and defend it.
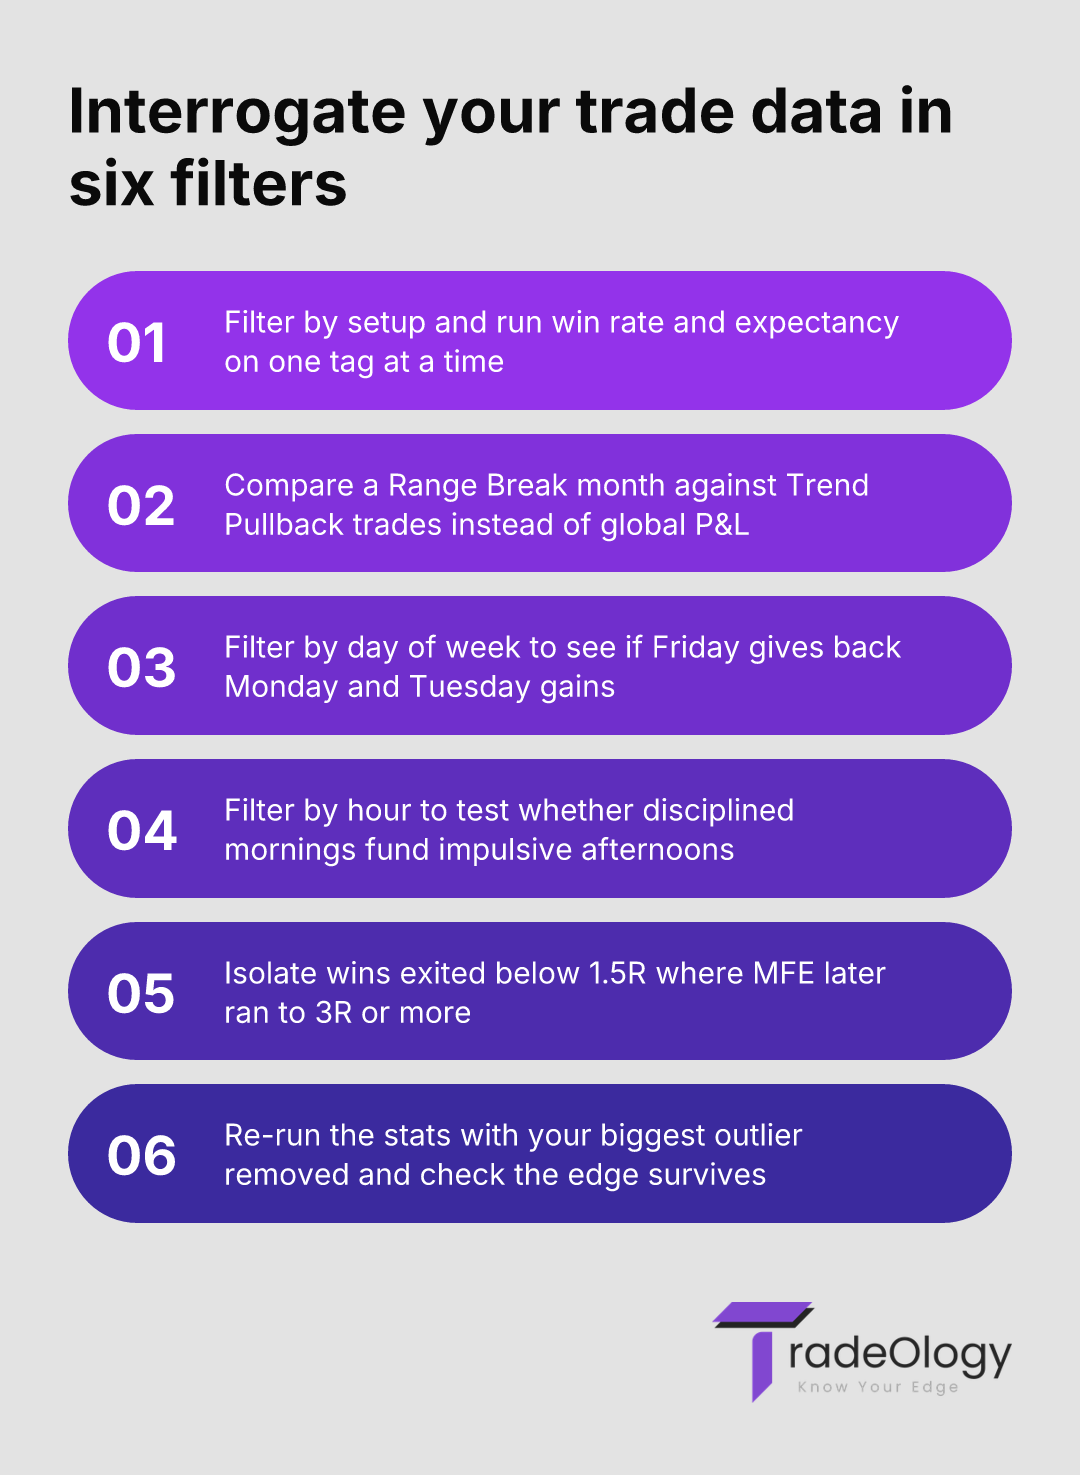
Filter 1: Isolate by Setup
Stop looking at your global P&L. It is a contaminated data set. In your trading analytics platform, filter your results to show one setup at a time. Run the numbers on *only* your "Range Break" trades from this month. What is their specific win rate? What is their expectancy? Now do the same for your "Trend Pullback" trades. You will inevitably find that one setup is a star performer and another is a quiet account killer. In the 2026 markets, volatility patterns have shifted. A setup that worked last year may be a liability now. The data will prove it.
Filter 2: Isolate by Time and Day
You think you trade the same way all day. You do not. Filter your trades by the day of the week. Are you giving back all of your Monday and Tuesday gains on Friday? The data shows many traders get aggressive, over-trade, or ignore their rules heading into the weekend. Now, filter by the hour. Are your disciplined morning trades paying for your impulsive afternoon trades? A clean dashboard does not fix this. Better review does.
Filter 3: Isolate by Performance
Go beyond win/loss. Create a filter for "Unrealized Gains." Look at all winning trades where you exited below 1.5R but the MFE shows the trade eventually ran to 3R or more. This is not a strategy problem. This is a psychological problem. Your fear of giving back profit is strangling your winners. The P&L shows a win, but your process analytics show a massive leak in profitability.
Real Trading Example: The 60% Winner Who Is Losing
Here is where traders fool themselves. Let’s look at a typical scenario.
A trader has a $100,000 account and risks 1% ($1,000) per trade. Over 50 trades, the results look like this:
Total P&L: +$2,000
Wins: 30 (60% win rate)
Losses: 20 (40% loss rate)
The trader feels good. A 60% win rate is strong, and the account is up. But they are ignoring the warning signs. The trading analytics tell a different story.
Average Win: $400
Average Loss: $500
Their expectancy is ($400 * 0.60) - ($500 * 0.40) = $240 - $200 = $40 per trade. It is positive, but barely. They are taking on $1,000 of risk to make an average of $40. The risk-reward is broken. A slight dip in win rate would turn the entire system negative.
This is not a winning strategy. It is a high-wire act. The high win rate creates a false sense of security while the poor risk-reward structure is a ticking time bomb. This trader needs to stop celebrating the win rate and start fixing their profit targets and position sizing.
Common Mistakes in Trade Data Analysis
Focusing on Win Rate: It is the most seductive and misleading metric in trading. A high win rate means nothing if the losses are uncontrolled.
Ignoring Outliers: One massive win can make a month look successful, hiding dozens of undisciplined errors and a broken process. Exclude the outlier and re-run your stats. Do you still have an edge?
Using P&L as a Health Metric: Your P&L is a result, not a diagnosis. A profitable month can mask a flawed system propped up by luck. A solid expectancy is a health metric; P&L is not.
Not Tagging Trades: "If you don't tag it, you can't track it." Failing to tag every trade by setup, mistake, and confluence factor makes deep analysis impossible.
Confusing Backtesting with Live Analysis: Backtesting shows what a system *could* do. Live trading analytics shows what *you* actually do with that system. They are not the same thing.
How TradeOlogy Cures Superficial Analysis
This level of analysis is impossible if your data is trapped in brokerage reports or a messy spreadsheet. It requires a dedicated tool built for traders.
TradeOlogy is not a dashboard. It is an interrogation tool. It automates the entire process of finding your real edge. All the filtering, sorting, and statistical analysis described above happens in seconds, not hours.
Instead of manually calculating your MAE, you use our analytics to see how your entry timing is affecting your drawdown. Instead of guessing which setup works best, you use our tag-based filtering to get a hard P&L and expectancy number for every strategy in your playbook. This is how you move from guessing to knowing. This is how you perform a real trade review.
FAQ About Trading Analytics
How often should I review my trading analytics?
A deep, surgical review should be conducted weekly. No exceptions. A quick daily review of the day's trades against your core metrics is also necessary to keep your process tight.Can trading analytics predict my future profits?
No. It diagnoses the health and stability of the process that generates those profits. A healthy, positive-expectancy process is more likely to produce consistent results, but it offers no guarantees.I have a high win rate but I'm not making money. Why?
This is the classic sign of a broken risk-to-reward profile. Your average loss is wiping out your string of small wins. Your expectancy is likely negative. You are celebrating wins that do not pay enough to cover the inevitable losses.What is the most important metric to start with?
Expectancy. It is the master metric because it combines your win rate and your risk-reward ratio into one number that tells you if you have a statistical edge. Start there.
Your Data Demands a Verdict
Your trading analytics are not a report card for you to judge at the end of the month. They are an x-ray of your decision-making process, available in real-time. Stop patting yourself on the back for a green P&L and start interrogating the data that produced it. The leaks in your system are there, recorded on every trade. Your edge is not found in a new indicator; it is found by fixing those leaks. The data is already there. Stop ignoring it.