

Swing trading holds positions for days or weeks while day trading closes everything before the session ends, and the number that separates them is expectancy per unit of time at risk, not expectancy per trade. Almost every trader who argues about swing trading vs day trading argues about the wrong figure. They compare quarterly P&L, or they compare average winners, and both comparisons are rigged in favour of whichever style they already run. Then they switch, keep the same dollar risk, and discover their drawdown got deeper while their annual return stayed flat.
Why swing trading vs day trading gets decided on the wrong number
The common mistake is comparing raw dollars across two styles that trade at different frequencies. A day trader who nets $200 a day and a swing trader who nets $2,000 a position are not comparable until both are converted to R and divided by days of capital exposure. Skip that step and you will always conclude that swing trading is more profitable, because the individual numbers are bigger.
The second mistake is more expensive. Traders carry their day-trading risk model into overnight holds. A $500 stop on a 4-hour hold is a $500 stop. The same $500 stop on a three-day hold is a $500 intention, and the gap decides the rest. Look at your own R-multiple histogram: if the left tail extends past -1R on overnight trades but stops cleanly at -1R on intraday trades, your risk per trade is not what your position size calculator told you it was.
Head-to-head on the dimensions that actually decide it
Dimension | Day trading | Swing trading |
|---|---|---|
Sample size per quarter | 150-250 round trips, enough for a reliable profit factor | 25-50 round trips, where variance still dominates |
Expectancy per trade | Typically 0.10R to 0.25R | Typically 0.30R to 0.60R |
Loss control | Stops fill near plan, average loss stays under 1R | Gaps push average loss to 1.1R-1.4R |
Cost drag | Commission and slippage compound across every fill | Negligible per trade, replaced by overnight financing or margin |
Drawdown shape | Frequent shallow dips, recovers within weeks | Fewer, deeper equity curve steps down |
Feedback speed | A broken rule shows up in 20 trades | A broken rule can hide for two quarters |
What actually matters: expectancy, profit factor and holding period analysis
Three metrics settle this, and they have to be read together. Expectancy in R tells you what one unit of risk returns. Profit factor tells you how hard the account works for that return. Holding period analysis tells you where inside the trade the return was actually generated.
That third one is the piece most traders never run, and it is where the comparison usually collapses. Bucket every closed trade by time in position: under 20 minutes, 20 to 90 minutes, 90 minutes to one session, and multi-day. Then compute expectancy per bucket. Day traders who do this frequently find their sub-20-minute bucket sitting near zero expectancy after costs, while the 90-minute-plus bucket carries the entire edge on a fraction of the trade count.
If that describes your data, switching to swing trading is the wrong correction. The correct correction is holding your existing setup longer inside the session. You already know the setup works. You have been cutting it at the point where it starts paying.
The review process that resolves it in your own log
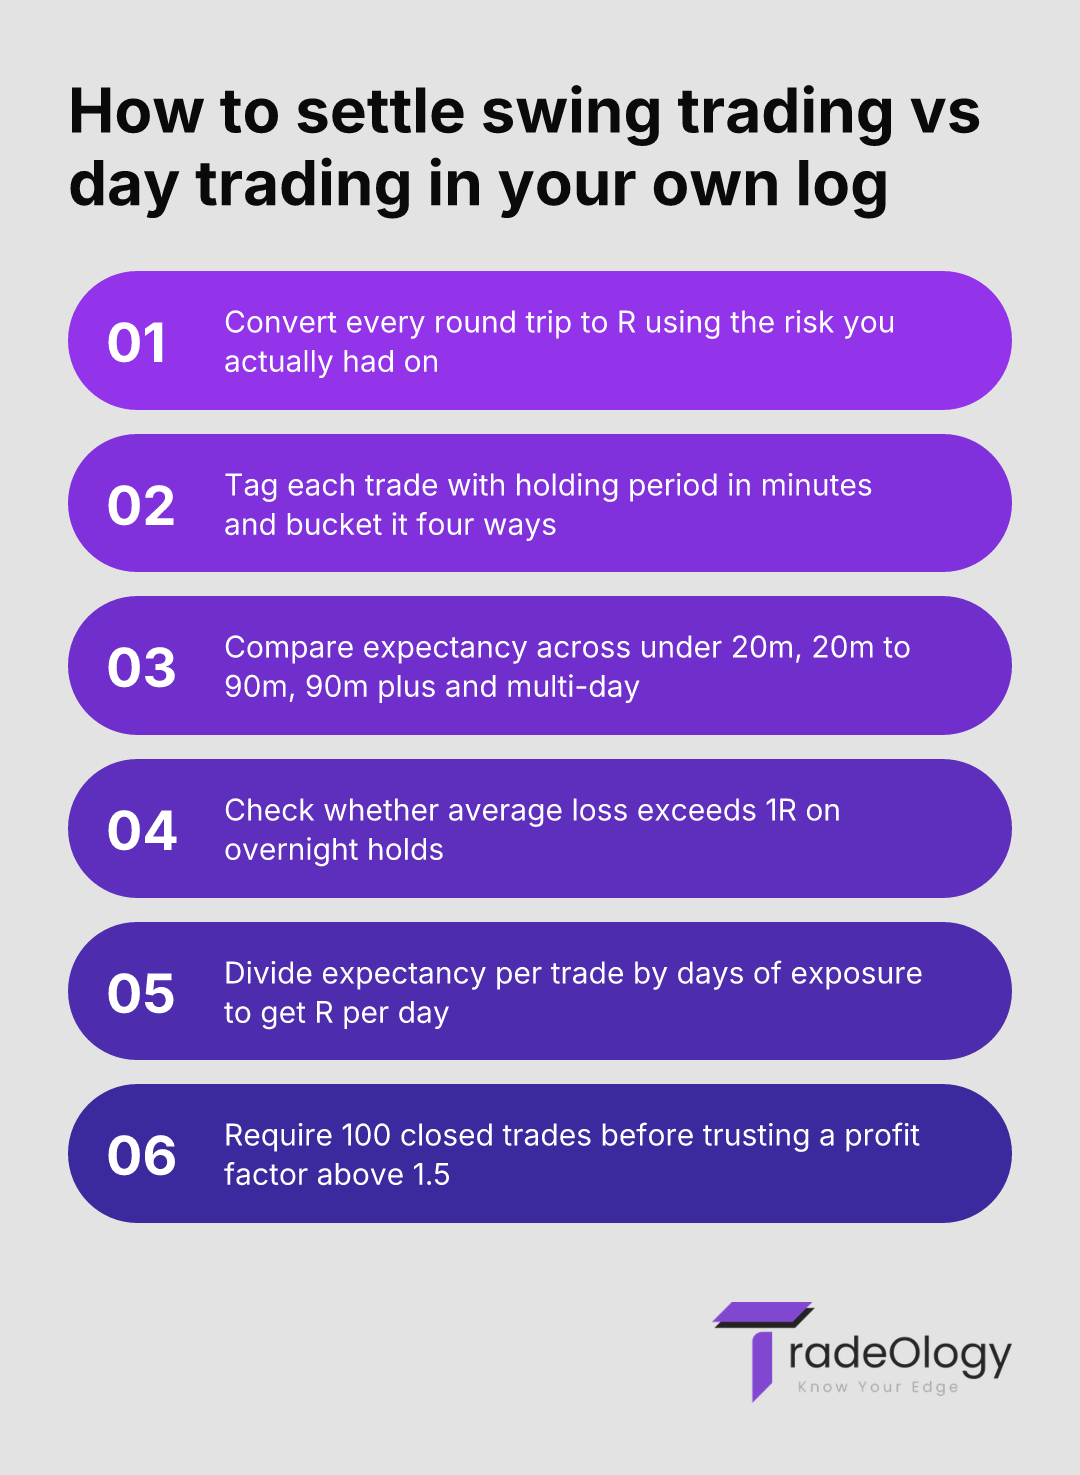
Run this on your last 100 closed trades minimum. Fewer than that and you are measuring noise.
Convert every round trip to an R-multiple using the risk you actually had on, not the risk you planned.
Tag each trade with holding period in minutes and bucket it into four ranges.
Calculate expectancy and profit factor per bucket, then per session and per weekday.
Compare average loss across intraday and overnight buckets to find your true gap cost.
Divide expectancy per trade by average days of exposure to get R per day of capital at risk.
Metric | What it actually means | Action to take |
|---|---|---|
Expectancy 0.40R, only 30 trades a quarter | Good per-trade edge, almost no compounding and no statistical confidence | Keep the style, raise frequency inside the same rules before raising size |
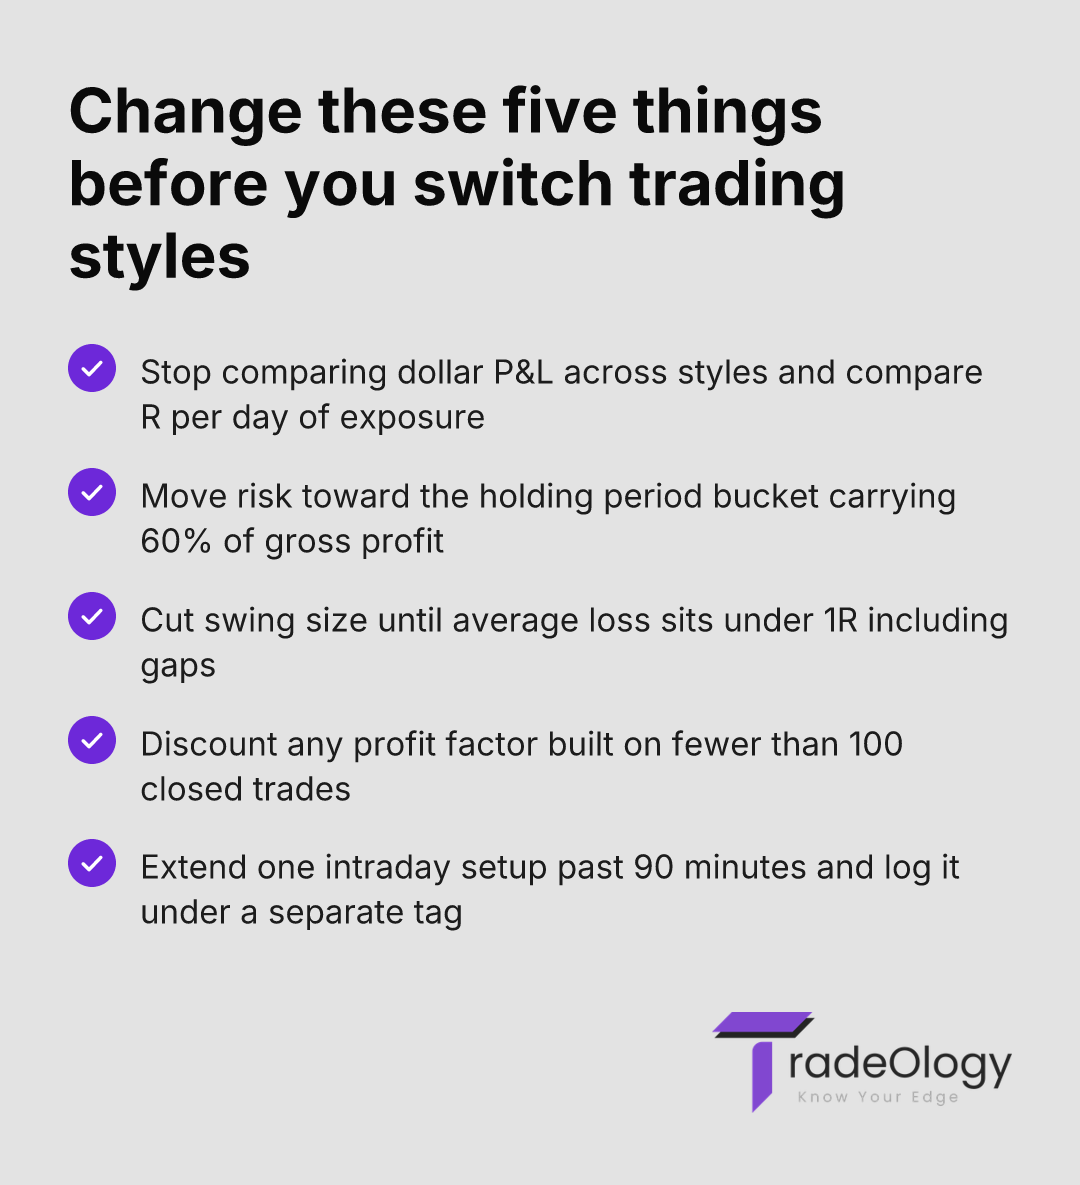
Average loss above 1.1R on overnight holds | Gaps are sizing your losers, not you | Cut swing position size until average loss including gaps sits under 1R |
Profit factor 1.6 on 34 trades | Statistically indistinguishable from 1.1 at that sample size | Hold size flat until 100 closed trades confirm the figure |
Sub-20-minute bucket expectancy near 0.00R | Commission and spread are eating a real signal | Eliminate that bucket and reallocate the risk to the 90-minute-plus bucket |
R per day of exposure falling as hold time rises | Capital is parked, not working | Set a time stop at the point where marginal R per day turns negative |
A worked example on a $50,000 account
Same trader, same $50,000 account, same 1% risk of $500 per trade, two quarters run in different styles.
Day trading quarter: 180 round trips, 46% win rate, average win 1.35R, average loss -0.85R. Expectancy is 0.16R, or $81 per trade. Profit factor 1.35. Net for the quarter: about $14,580.
Swing trading quarter: 34 round trips, 41% win rate, average win 2.60R, average loss -1.15R. Expectancy is 0.39R, or $194 per trade. Profit factor 1.57. Net for the quarter: about $6,590.
The swing quarter wins on every per-trade metric and loses on money. It also hides a defect: that -1.15R average loss means the trader was risking 15% more than planned on the losing side, silently, through gaps. Correct for that and swing expectancy drops toward 0.34R. Meanwhile the day trading quarter had 180 samples, which is enough to trust the profit factor within a reasonable confidence band. The swing quarter's 1.57 could plausibly be 1.05 with a different draw of the same 34 trades.
If trades held longer than 90 minutes produce more than 60% of your gross profit while making up under 20% of your trade count, your session-close exit is a fee you charge yourself, and no change of style will refund it.
Where each style genuinely fails
Day trading fails on cost and access. Every extra fill pays the spread again, and a strategy with 0.16R expectancy loses a meaningful share of it to commission at small size. In the US, FINRA's pattern day trader rule still requires $25,000 minimum equity in a margin account in 2026, which prices out under-funded accounts entirely.
Swing trading fails on sample size and gap risk. Two quarters of data is 60 or 70 trades, which is not enough to distinguish a real edge from a fortunate sequence. Overnight exposure also breaks the one thing your position sizing depends on: a stop that fills where you put it.
Our own limitation is worth naming. TradeOlogy reads what you executed. If your broker CSV lacks fill timestamps, holding period analysis degrades to date-level buckets and the sub-20-minute insight disappears. We also cover stocks, options, futures and crypto only, so if part of your book is in currency pairs, that part stays outside the analysis.
Who should pick which
The trader whose 90-minute-plus bucket already carries the edge should stay intraday and extend holds, not switch styles. The trader with under $25,000 in a US margin account should swing trade, because the alternative is three round trips a week under the PDT rule. The trader who cannot sit at a screen from the open should swing trade and accept the slower feedback loop, sizing at 0.5% instead of 1% until 100 trades exist. The trader with fewer than 50 logged round trips and no idea which bucket pays should day trade small for a quarter purely to generate a usable sample, then decide with data instead of preference.
Mistakes that keep the comparison unresolved
Comparing gross P&L instead of R per day of exposure, which flatters whichever style holds longest.
Carrying identical dollar risk from intraday to overnight and letting gaps set the real loss size.
Judging a swing strategy on 30 trades, then scaling size on a profit factor built from noise.
Tagging by ticker instead of by holding period, so the log records what happened but never explains why.
Switching styles after a losing month, which resets the sample and destroys two quarters of comparison data.
Where TradeOlogy fits
Connect the account or import the CSV and the platform rebuilds executions into round trips, then splits expectancy, profit factor, win rate and drawdown by setup tag, session and hour. The comparison this article describes is a filter operation: bucket by holding period, read expectancy per bucket, then check average loss inside each. What normally takes an afternoon in a spreadsheet becomes a sort. It will not tell you which style suits your temperament, and it cannot analyse trades you never took, which is the honest boundary of any journal tool. If you want the per-day framing in more depth, we broke it down in what swing trading pays per day of exposure. The trial requires a card and you can cancel anytime.
FAQ
Why is my swing trading expectancy higher but my account growing slower?
Expectancy per trade ignores frequency and capital lock-up. A 0.39R edge on 34 trades returns less than a 0.16R edge on 180 trades, even though the first looks better on paper. Divide expectancy by average days of exposure to get the figure that actually compounds.
How many trades do I need before trusting a swing trading profit factor?
Around 100 closed round trips as a working floor, and more if your win rate sits below 40%. Below that, a profit factor of 1.6 and one of 1.05 are not statistically distinguishable. Keep size flat until the sample fills out, then scale.
Do overnight gaps really change my position sizing math?
Yes, and the evidence sits in your average loss. If planned risk is 1R and your realised average loss on overnight holds is 1.15R, your effective risk per trade is 1.15%, not 1%. Size down until that figure returns under 1R.
Should I run both styles at once while comparing them?
Only with separate tags and separate risk budgets. Blended logs make holding period analysis useless because the buckets overlap. Tag every trade at entry with its intended style, then compare expectancy per bucket after 100 trades in each. Our expectancy guide covers the calculation.
The verdict on swing trading vs day trading
Swing trading vs day trading is not a personality question, it is a sizing and sample-size question, and your last 100 trades already contain the answer. Bucket them by holding period, check whether your average loss survives contact with a gap, and put risk where expectancy per day is highest. The trader who runs that filter stops debating styles and starts fixing the one bucket that is bleeding.