

A swing trader hands me nine months of statements: 58% win rate, 1.62 profit factor, no blown accounts. The account is up 14%. He wants to know why it feels like nothing. The setups are not the problem. The calendar is. His average hold is 11 sessions, his book sat exposed to the market on roughly 70% of available trading days, and every one of those days carried overnight gap risk he never priced.
So what is swing trading, measured honestly? It is renting exposure. You pay for that rental in overnight risk, in capital that cannot be redeployed, and in the psychological cost of watching an open position for two weeks. Per-trade expectancy does not bill you for any of it.
What is swing trading when you measure exposure instead of entries
Swing trading holds a position across multiple sessions to capture a directional move, usually two to fifteen sessions in stocks, options, futures or crypto. That is the textbook part, and it is the least useful part. The definition tells you nothing about whether your version works.
Day traders are graded per trade because their exposure resets at the close. Swing traders inherit that scorecard and it fits badly. A 0.55R expectancy earned over 12 sessions and a 0.20R expectancy earned over 2 sessions are not comparable numbers, yet almost every swing trader compares them anyway. The second one is roughly three times the business.
Equity and futures swings also carry a risk crypto does not: the tape closes. Your stop does not exist between 4:00pm and 9:30am. Traders who avoid the FINRA pattern day trader $25,000 equity requirement by swinging instead of daytrading are not avoiding risk. They are trading intraday slippage for gap risk, and gap risk is fatter-tailed.
The metric almost no swing trader calculates
Divide total R produced by total exposure days. That is expectancy per day held, and it is the only number that lets you compare a swing book to anything else you could do with the same capital.
Run it in buckets: trades held 1-2 sessions, 3-5, 6-10, 11+. In most retail swing books I have reviewed, the shape is consistent and unpleasant. Expectancy per day peaks in the 1-5 session bucket, flattens through 6-10, and goes negative past 11. The trades you are proudest of holding are the ones funding your drawdown.
There is a mechanical reason. Winners resolve fast because the thesis was right on entry. Losers get held because the thesis was wrong and holding is cheaper than admitting it. The long-hold bucket therefore fills with losers by selection, not by chance. Your 11+ session bucket is not a strategy. It is a hospice.
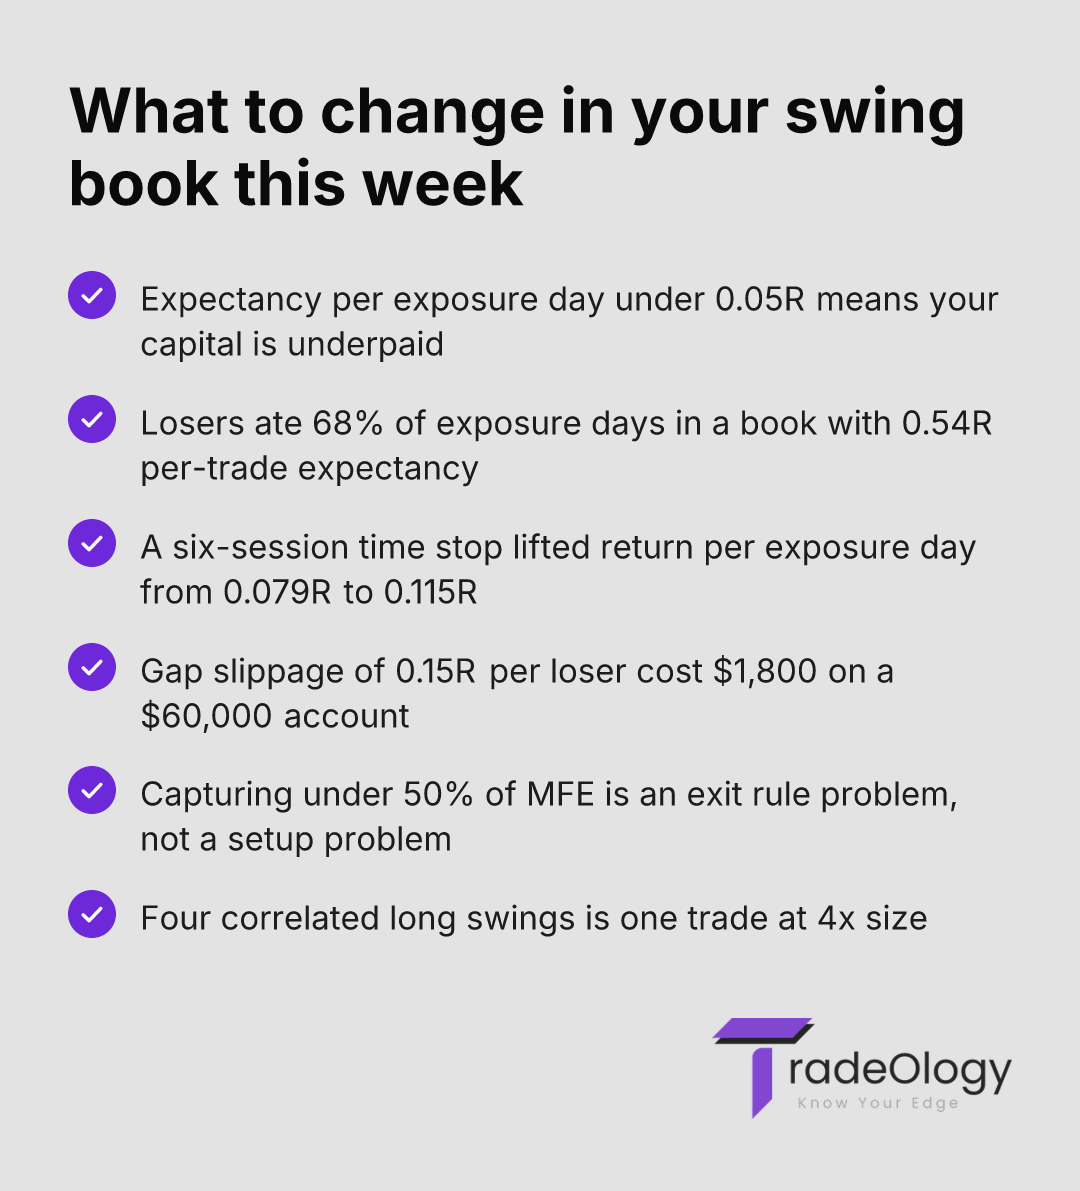
This is why expectancy alone misleads swing traders. A 0.54R per-trade expectancy looks strong until you learn the losers consumed 68% of the exposure days that produced it.
The review process that finds it
You need entry timestamp, exit timestamp, R-multiple, and MFE for every round trip. Nothing exotic. Most traders already have it and have never sorted by it.
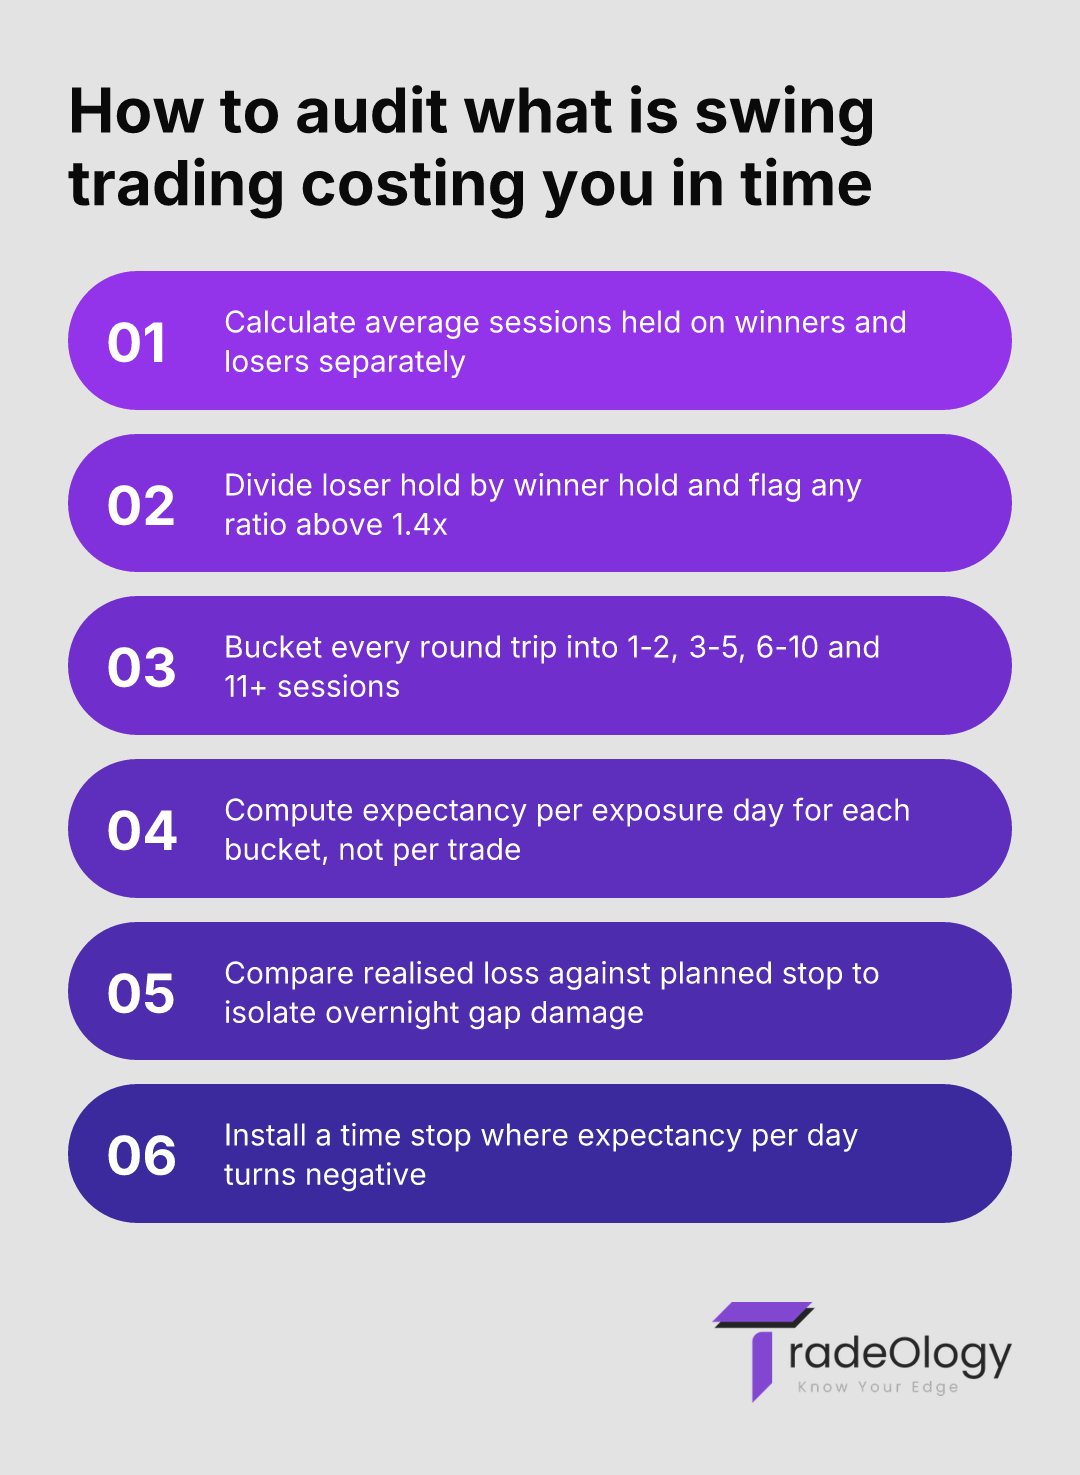
Calculate average sessions held on winners and on losers separately, then divide loser hold by winner hold.
Bucket every closed trade into 1-2, 3-5, 6-10 and 11+ sessions and compute expectancy per exposure day for each.
Tag the session on which each trade reached its maximum favourable excursion, then check what percentage of MFE you actually captured.
Compare realised loss size against planned stop size to isolate how much of your damage came from overnight gaps.
Eliminate the bucket with negative expectancy per day by installing a hard time stop, then re-run the book.
The MFE timing check is the one that changes behaviour fastest. If 70% of your winners hit peak unrealised profit by session four and you routinely hold to session nine, you are not letting winners run. You are giving them back.
Reading the output
Metric | What it actually means | Action to take |
|---|---|---|
Expectancy per exposure day < 0.05R | Your capital is tied up earning less than a short-hold book would. | Cut the longest-hold bucket and re-measure over 30 trades. |
Loser hold > 1.4x winner hold | You are managing hope, not risk. Win rate is inflated by delay. | Install a time stop at the winner average plus two sessions. |
MFE captured < 50% | The setup finds the move. The exit rule cannot close it. | Trail from the session your MFE distribution peaks, not from entry. |
Realised loss > 1.15x planned stop | Gaps are pricing your exits, not you. | Size down on earnings-adjacent holds or use defined-risk options. |
A real book, run both ways
A $60,000 equity account, 1% risk per trade, $600 per unit of R. Forty-two swing trades over six months. Twenty-two winners at an average +2.1R, held 4.2 sessions each. Twenty losers at an average -1.15R, held 9.8 sessions each.
Per-trade expectancy: 0.54R. Net: 22.7R, or about $13,600. Respectable on paper. Now the exposure. Winners consumed 92 session-days, losers consumed 196. Total 288. That is 0.079R per exposure day, and losers ate 68% of the time in the market.
Rerun with a hard time stop at six sessions. Losers exit earlier at an average -0.95R, freeing 76 exposure days. Three winners get cut before their target, costing 2.8R. New net: 24.4R across 212 exposure days, or 0.115R per day. Same setups, same entries, same risk per trade. Forty-five percent more return per day of capital at risk, and 76 fewer nights of gap exposure.
The -1.15R average loss deserves its own attention. Planned risk was 1.0R. The extra 0.15R across 20 losers is $1,800 of pure overnight slippage, and it never appeared in his journal because he only logged intended stop levels. That is the difference between a trade log and an actual journal.
If your average losing swing trade is held more than 1.4x as long as your average winner across your last 50 round trips, your win rate is not measuring edge. It is measuring how long you can tolerate being wrong, and one gap will reprice the whole number.
Where swing books leak
Counting a hold as free. Ten sessions of exposure on one name is capital that produced nothing on the other nine setups you passed.
Sizing overnight risk like intraday risk. A 1% stop is not a 1% risk when the tape is closed for 17 hours.
Running correlated swings. Four long semiconductor positions is one trade at 4x size, and your drawdown chart will say so.
Widening a stop on day six. That single edit converts a -1R into the -2.4R that defines your worst month.
Reviewing swing trades daily. Daily review on a multi-session book manufactures interference. Review by a fixed weekly cadence instead.
Doing this in TradeOlogy
Connect a brokerage account or import a CSV and TradeOlogy stitches your executions into round trips with timestamps on both ends. That gives you the raw material the exposure calculation needs: hold length, R-multiple, and realised versus planned risk on every closed position.
Tag each round trip by hold bucket and setup, then read expectancy, profit factor and drawdown per bucket rather than per account. The bar where expectancy per day turns negative is the one to act on. Filtering by setup and session on top of that shows whether the leak is one strategy or the whole book — the approach covered in breaking analytics down by setup. The trial requires a card and you can cancel anytime.
Before you change a rule, check the sample. Thirty trades per bucket is a working minimum, and strategy evaluation on smaller samples tends to reward noise.
FAQ
How do I set a time stop without cutting my best swing trades?
Plot the session on which each winner reached maximum favourable excursion. Set the time stop two sessions beyond the 80th percentile of that distribution. In the book above that landed at six sessions, which cost 2.8R in truncated winners and saved 4R in truncated losers.
Why does my swing expectancy look strong while the account barely grows?
Because expectancy per trade ignores turnover. Forty-two trades at 0.54R sounds fine until you notice they occupied 288 exposure days. Divide total R by exposure days, then compare that figure against a shorter-hold version of the same setups.
Should swing traders judge performance on win rate at all?
Only alongside average hold time. A high win rate produced by holding losers until they recover is a delayed drawdown, not an edge. Split hold time by outcome and the inflation shows up immediately.
How much extra risk do overnight gaps actually add?
Measure it rather than assume it. Compare realised loss to planned stop across your last 50 losers. In the example, gaps added 0.15R per loser, which was $1,800 on a $60,000 account in six months — roughly 13% of net profit.
The standard
Stop asking what is swing trading and start asking what your swing trading pays per day of exposure. If that number sits under 0.05R, the setups are not broken — the holding period analysis you have never run is hiding a book that rents risk cheaply and sells it cheaper.
Verdict: What is swing trading really? It is a bet on time as much as direction, and any swing trading strategy graded only on per-trade expectancy will flatter itself. Measure expectancy per exposure day, cut the bucket where it goes negative, and the same entries produce materially more return on the same capital.