

Expectancy is the average dollar or R-multiple a strategy returns per trade, calculated as win rate multiplied by average win, minus loss rate multiplied by average loss. A 70% win rate tells you how often you were right. It says nothing about what being right paid. That gap is where most work on stock trading strategy expectancy stops: traders compute one number, see a plus sign in front of it, and never check whether their money agreed with their trade count.
Why win rate keeps winning an argument it should lose
Win rate is the fastest feedback a trader gets. You know it before the day is over. Expectancy needs a hundred closed round trips and a spreadsheet, so it loses the attention contest every time.
The damage is behavioural, not arithmetic. Once a trader starts protecting a win rate, the behaviour that protects it is always the same: take profit early, widen the stop, hold the loser through the level that invalidated the idea. Win rate climbs. Average win shrinks. Average loss grows.
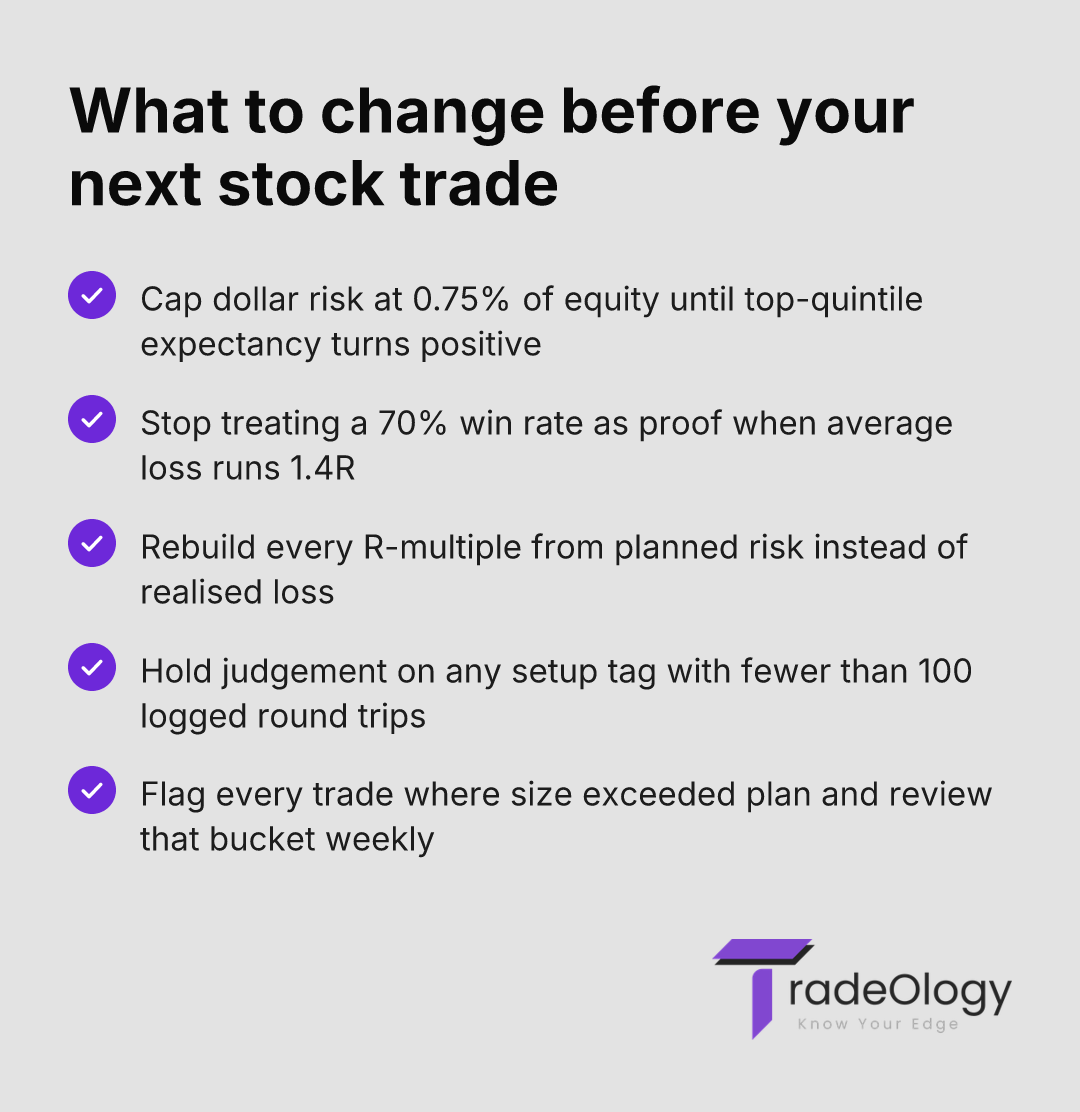
Run the arithmetic on that drift. Start at 52% wins, 1.6R average win, 1.0R average loss. Expectancy is plus 0.35R. Drift to 70% wins, 0.55R average win, 1.4R average loss, and expectancy is minus 0.035R. Across 300 trades at $400 of risk each, that is minus $4,200 before commissions, produced by a trader who is right seven times in ten. Win rate is not the metric, and chasing it actively converts a working strategy into a losing one.
Stock trading strategy expectancy is a per-trade number, but you are paid per dollar
Here is the part almost nobody checks. Expectancy weights every trade equally. Your broker does not. If your risk per trade ranges from $250 to $1,800, a single number averaged across trade count is describing a portfolio you never actually traded.
Compute both. Per-trade expectancy is the mean of your R-multiples. Dollar-weighted expectancy is the sum of R multiplied by dollar risk, divided by total dollar risk. When those two figures disagree, the difference is pure sizing behaviour.
They disagree more often than not, and the direction is consistent. Sort your closed trades into five quintiles by dollar risk and score expectancy inside each. Discretionary traders repeatedly find the top quintile running 0.3R to 0.6R below their overall figure. The chain is not mysterious: size goes up after a winning streak, and after a winning streak the move is extended and the entry is late. You bet most on the trades that deserve least.
That produces the specific pathology of a flat equity curve with positive stats. Per-trade expectancy of plus 0.21R across 200 trades looks like a business. Dollar-weighted expectancy of plus 0.02R across the same 200 trades is a hobby. Check the quintile table before you touch a single entry rule.
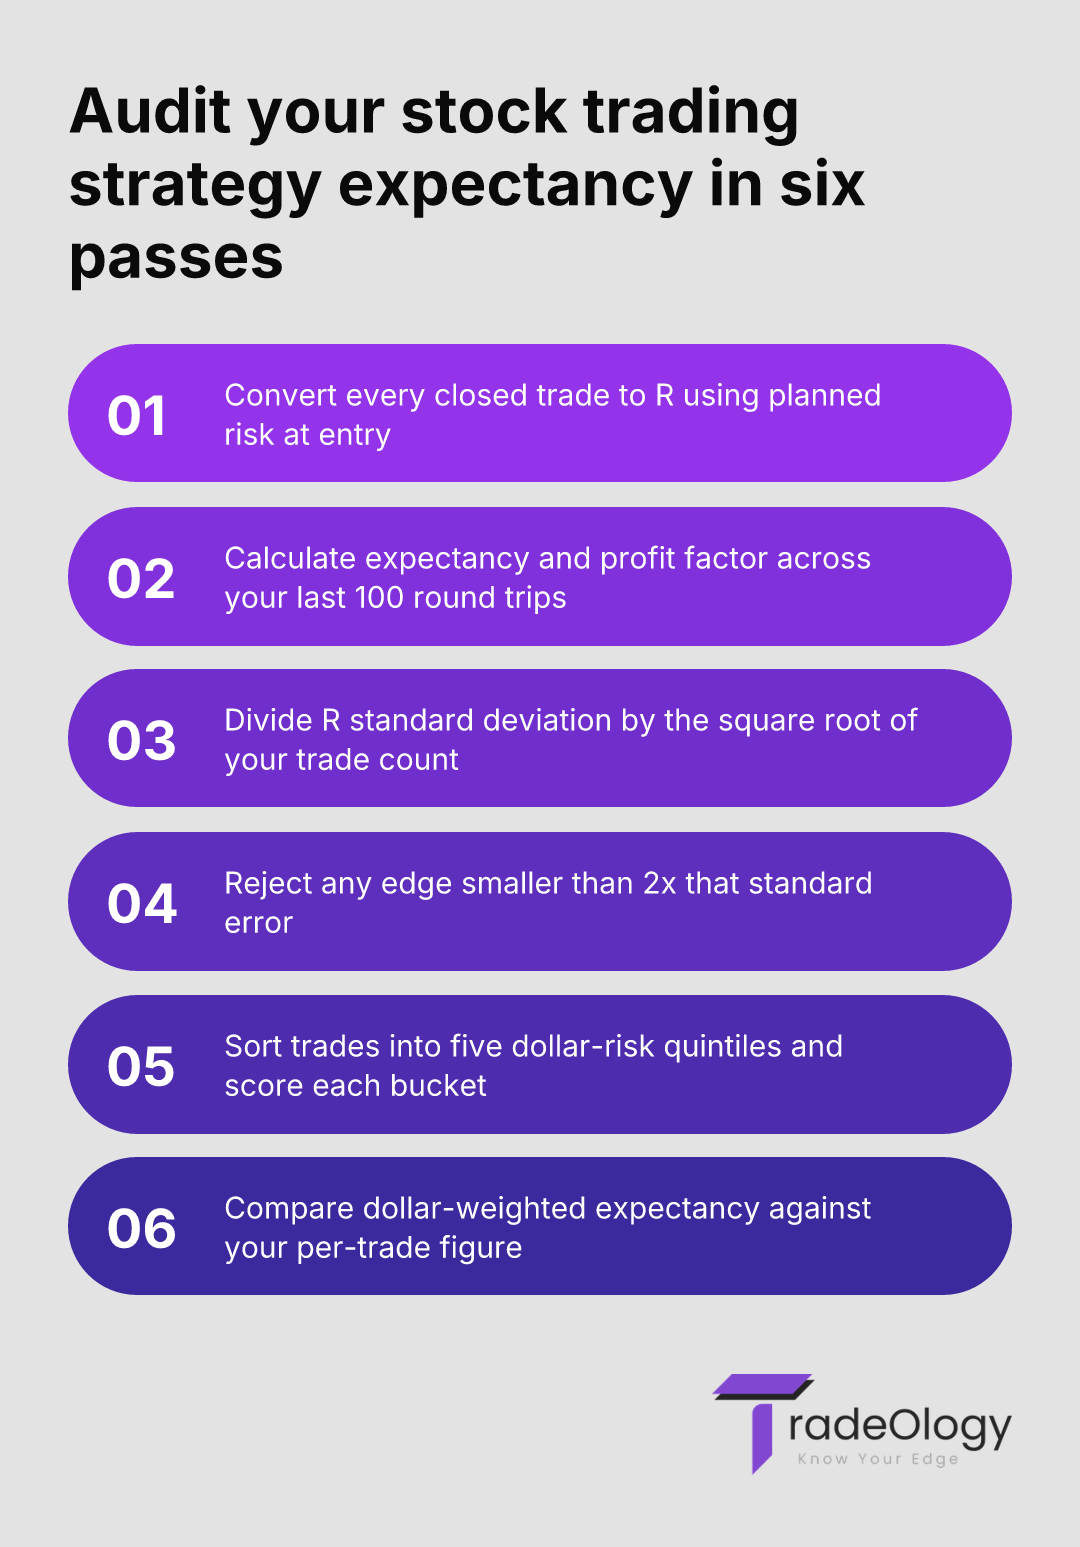
The six-pass expectancy audit
Do these in order. Skipping to pass five without pass three is how traders build conviction on noise.
Convert every closed trade to R using planned risk at entry, never the realised loss.
Calculate expectancy, profit factor and win rate across your last 100 or more round trips.
Divide the standard deviation of your R-multiples by the square root of your trade count to get the standard error of that expectancy.
Reject any measured edge smaller than twice its standard error and keep size at minimum until n grows.
Sort trades into five dollar-risk quintiles and score expectancy inside each bucket separately.
Compare dollar-weighted expectancy against per-trade expectancy and treat the gap as a sizing defect.
Pass three kills more false edges than anything else. With 40 trades and an R standard deviation of 1.4, the standard error is 0.22R. A measured expectancy of plus 0.20R is statistically indistinguishable from zero. You do not have an edge. You have a sample.
Reading the numbers without flattering yourself
Metric | What it actually means | Action to take |
|---|---|---|
Expectancy +0.20R, n = 40, R stdev 1.4 | Standard error is 0.22R, so the edge is indistinguishable from zero. | Hold minimum size until the sample passes 100 round trips. |
Win rate 70%, average loss 1.4R | Expectancy is negative despite being right seven times in ten. | Extend targets or drop setups that require a 1.4R stop. |
Dollar-weighted expectancy below per-trade expectancy | Your largest positions hold your worst trades. | Fix risk at a flat percent of equity for 50 trades. |
Profit factor 1.29 over 214 trades | Gross profit clears gross loss by only 29% across a full year of work. | Cut the lowest-expectancy setup tag before adding any size. |
Positive expectancy with 30% max drawdown | The edge is real but the sequencing risk is unfunded. | Halve size automatically once drawdown reaches 12%. |
Profit factor and expectancy answer different questions. Profit factor tells you the ratio of money won to money lost. Expectancy tells you what one trade is worth. A strategy can pass one and fail the other, which is why evaluating a strategy on a single metric is how weak systems survive review.
A worked example: 214 trades, half the profit given back
An $85,000 equities account, 214 round trips closed during 2025. Win rate 61%. Average win $430, average loss $520. Expectancy per trade is $59.50, so the year finished around $12,700 with a profit factor of 1.29. On paper, a working strategy.
Now the quintile pass. Risk per trade ranged from $250 to $1,800. Per-trade expectancy in R terms was plus 0.14R. The top quintile, 43 trades with average risk of $1,340, scored minus 0.22R. That bucket alone cost roughly $12,700. The other 171 trades produced about $25,400.
The entries were never the problem. Cap risk at 0.75% of equity, or $640, and rerun that same top quintile without changing one trade decision. The loss shrinks to roughly $6,050. Same setups, same fills, same exits, and the year lands near $19,300 instead of $12,700. That is a 52% improvement bought entirely with a sizing rule.
If your largest 20% of positions by dollar risk show lower expectancy than your smallest 20%, your sizing is inverted, and no entry refinement will repair a strategy that bets hardest on its worst trades.
Mistakes that corrupt an expectancy figure
Calculating expectancy in dollars while position size varies six to one. The number then blends edge and sizing into one uninterpretable average.
Building R-multiples from realised loss instead of planned risk. Every trade you cut early gets recorded as a 0.4R loss when you actually risked 1R.
Excluding scratches and breakeven exits from the denominator. Dropping 20 flat trades out of 120 inflates expectancy by roughly 20%.
Declaring an edge on 30 trades, then tripling size on it. Variance handles the rest.
Comparing setups with different holding periods head to head. A 0.3R scalp and a 0.3R eight-day swing are not equivalent until you measure return per day of exposure.
Where TradeOlogy fits
None of this works from memory. It requires every execution rebuilt into round trips, tagged, and sliced. Connect a broker account or import a CSV, and TradeOlogy builds expectancy, profit factor, win rate and drawdown across stocks, options, futures and crypto, then breaks each one down by setup, by session and by hour.
The two views that matter here are the setup breakdown and the risk-size filter. Sort your setup tags by expectancy and the bottom one is usually the one you trade most. Filter by dollar risk and the top-quintile problem becomes visible in about ninety seconds instead of an afternoon in a spreadsheet. The full expectancy walkthrough covers the calculation side. The trial runs on a card and you can cancel anytime.
FAQ
How many trades before my expectancy figure means anything?
It depends on your R standard deviation, not a fixed number. Divide the standard deviation of your R-multiples by the square root of your trade count, and require expectancy to exceed twice that figure. For most intraday equity strategies with an R stdev near 1.4, that lands between 100 and 200 trades.
Why is my profit factor healthy while my expectancy per trade is tiny?
Profit factor is blind to trade count. Gross profit of $56,000 against gross loss of $43,000 gives a profit factor of 1.29 whether you took 50 trades or 500. Divide net profit by trade count and you learn whether each individual decision was worth its commission and screen time.
Should I measure expectancy in dollars or R-multiples?
Measure in R when judging the strategy and in dollars when judging the account. R strips out sizing, which isolates whether the setup itself has an edge. Dollars reveal whether your sizing captured that edge or handed it back through oversized losers.
Does moving to a trailing stop improve expectancy?
It raises average win and lowers win rate simultaneously, so the net effect is unknowable without your own data. Tag 50 trades with a trailing exit and 50 with a fixed target, then compare expectancy across the two tags. On high-volatility sessions the trailing version usually wins on R and loses on hit rate.
The standard to hold stock trading strategy expectancy to
A single positive expectancy number proves nothing on its own. It has to survive three tests: a sample large enough that the edge exceeds twice its standard error, a dollar-weighted version that matches the per-trade version, and a quintile breakdown where your biggest positions are not your worst performers. Fail any one of those and you are looking at a statistic, not an edge.
Verdict: stock trading strategy expectancy beats win rate because it prices every outcome instead of counting them, but only when you weight it by the dollars you actually risked. A trader with 70% wins and a negative expectancy is not unlucky, and a trader with a positive per-trade edge and a flat equity curve has a sizing problem the entry rules will never solve.