

Swing trading setups are repeatable multi-day entry patterns — moving-average pullbacks, consolidation breakouts, gap fills, failed breakdowns — and a pattern only counts as a setup once it has a written trigger, a fixed invalidation level, and enough closed trades to measure.
Most swing traders run four or five of these in rotation and cannot tell you which one carries the account. They remember the trade that went 3R and forget the eleven that scratched. So they keep funding a setup that has been flat for nine months and shrink size on the one setup that actually produces, usually right after a normal losing run.
Why traders misjudge which swing trading setups pay
The first error is the tag itself. "Breakout" is not a setup, it is a category. Traders lump a 3-day flag break in a low-volatility drifter together with a range expansion on an earnings gap, then average the two into a single meaningless number. Nothing actionable comes out of that. A tag you cannot define in one sentence with a price trigger is a folder, not a strategy.
The second error is timing the verdict emotionally. Traders kill setups after losing streaks and add size after winning streaks, which is variance-chasing dressed up as adaptation. At a 45% win rate, a six-loss streak appears in close to half of all 50-trade samples. Cutting the setup there is not discipline, it is a sample-size failure with a P&L cost.
The third error is judging win rate instead of expectancy. A gap-fill setup hitting 67% feels like the best thing in the book right up until you notice the average loss is twice the average win.
The volatility split hiding inside your setup tags
Here is the part that most trade tagging misses entirely. Take any setup with 40+ closed trades and split it by one variable: was the entry-day ATR above or below that instrument's own 60-day median ATR? Do not use a fixed dollar threshold, and do not use VIX as a proxy — the instrument's own volatility percentile is the input that matters, though the broader CBOE volatility regime is worth noting alongside it.
In most swing books, one half of that split carries virtually all the expectancy and the other half is roughly break-even. The pattern is not the variable. The volatility regime it fired in is. Pullback setups tend to pay in the expanded half because the retracement actually reaches your level and the target is reachable inside the hold window. In the compressed half, the same trigger produces slow bleed-outs and time stops.
This is falsifiable in about twenty minutes of work on your own data, and it changes what you do tomorrow. If the split shows a 0.7R gap, you do not have a bad setup. You have one setup you should be trading and one you should be skipping under the same name.
A review process that produces real performance by setup
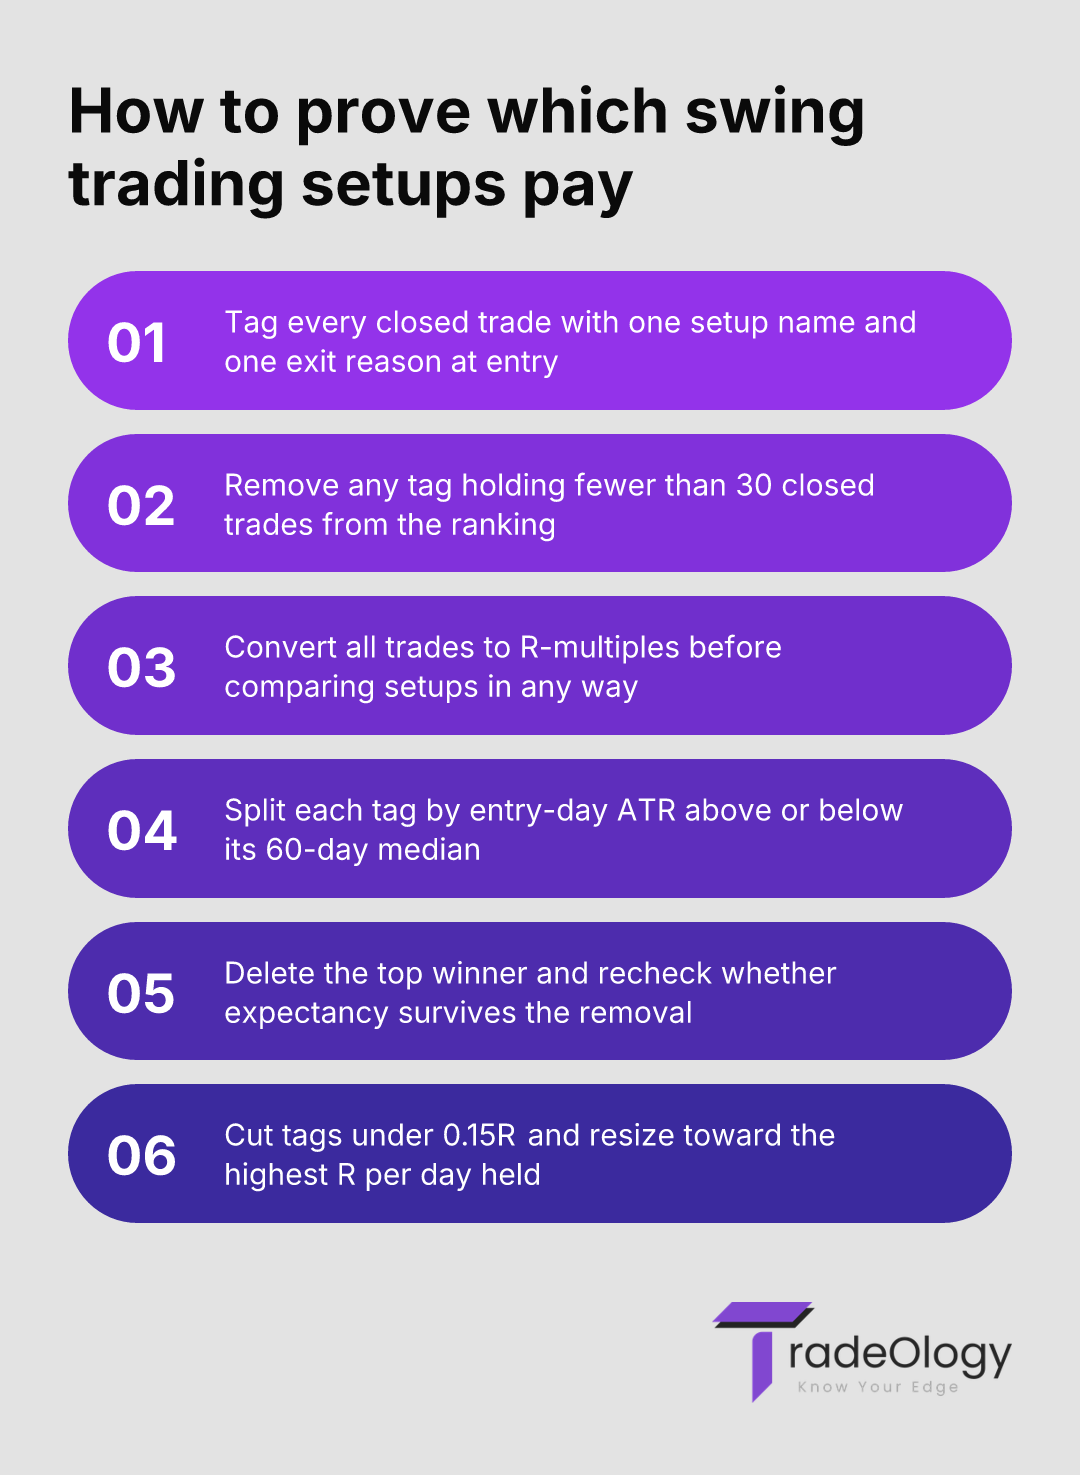
Work in R, not dollars. Dollar P&L is contaminated by position sizing changes, and you cannot compare a $200-risk trade to a $600-risk trade on a dollar basis. Convert every closed round trip to an R-multiple first, then group.
Tag every closed swing trade with exactly one setup name and one exit reason: target, stop, time stop, or discretionary.
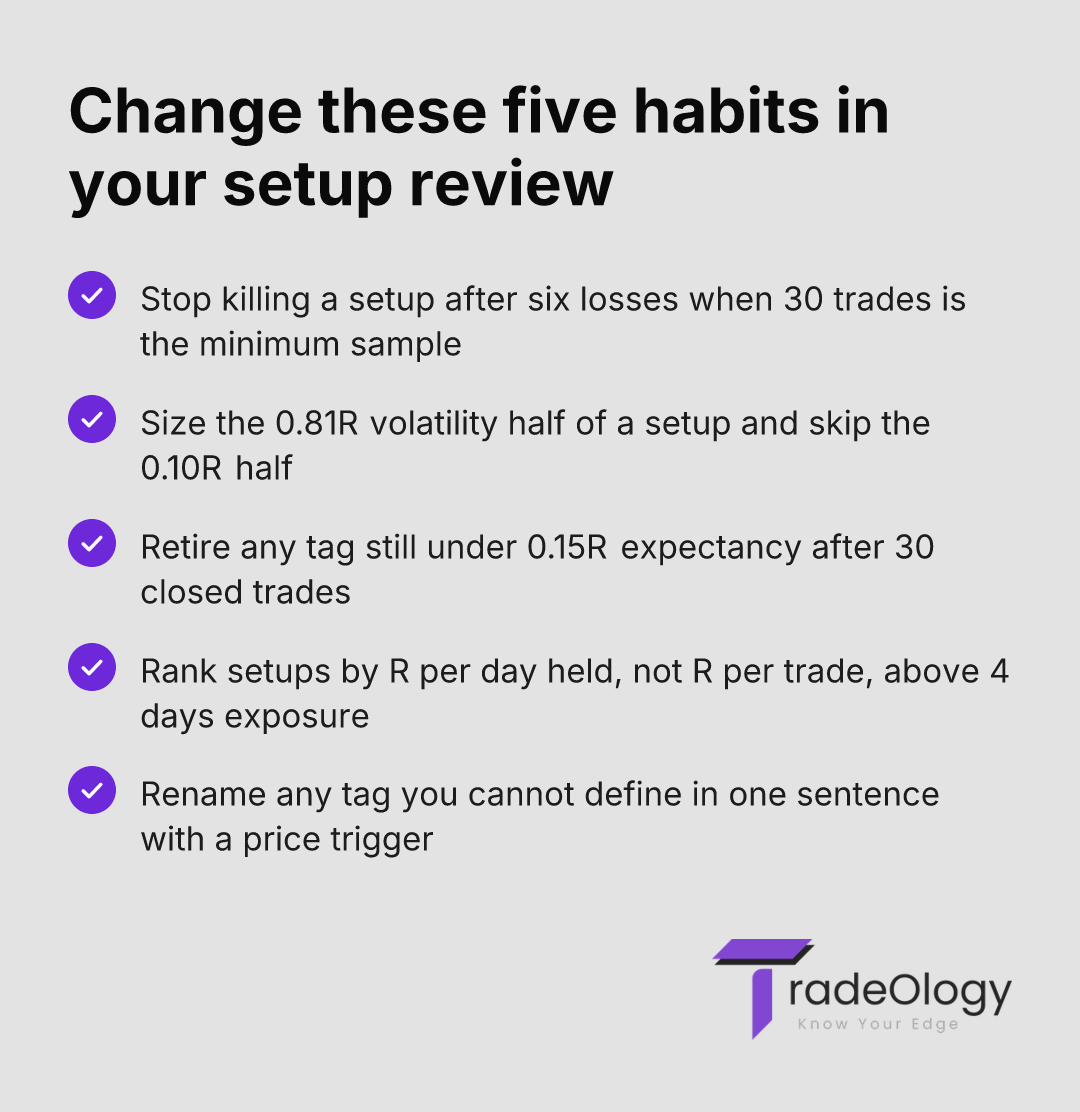
Eliminate any tag under 30 closed trades from the ranking entirely — hold its size flat until the sample fills.
Calculate expectancy in R for each tag, then divide by average days held to get R per day of exposure.
Split each qualifying tag by entry-day ATR above and below the instrument's 60-day median and compare the two expectancies.
Review the discretionary-exit bucket separately, because that is where your process leaks, not your setup.
One more filter that traders skip: check how much of each setup's total profit came from the single best trade. If removing the top winner drops a setup from 0.40R to 0.05R, you have one lucky trade and 29 pieces of noise. That test is faster than any statistical significance calculation and it catches the same problem.
Metric to meaning
Metric | What it actually means | Action to take |
|---|---|---|
Setup expectancy under 0.15R over 30+ trades | Commissions and slippage have already eaten the edge. | Retire the tag or restrict it to one volatility regime. |
0.7R expectancy gap between ATR halves | The volatility regime is the edge, not the pattern. | Trade only the half above the 60-day ATR median. |
67% win rate with average loss 2x average win | Your stops are wider than your targets by habit. | Move the stop inside the invalidation level or drop the setup. |
Profit factor 1.9 on 12 closed trades | Sample too small to size against. | Keep risk flat until the tag reaches 30 trades. |
0.43R over 6.5 days held | 0.066R per day of capital exposure. | Compare against shorter-hold tags before adding size. |
What 84 swing trades actually showed
A $50,000 account, 0.75% risk per trade, so $375 at 1R. Eighty-four closed swing trades over nine months, split across three tagged setups.
MA pullback — 41 trades, 51% win rate, average win 1.8R, average loss 1.0R. Expectancy 0.43R, or $161 per trade. Breakout continuation — 28 trades, 32% win rate, average win 2.6R. Expectancy 0.15R, or $57 per trade. Gap fill — 15 trades, 67% win rate, average win 0.7R, average loss 1.4R. Expectancy 0.007R. That last one is a rounding error dressed as the highest win rate in the book, and it was the setup the trader felt best about.
Now the split. Of the 41 pullback trades, 19 fired with entry-day ATR above the 60-day median and returned 0.81R. The other 22 fired in compressed volatility and returned 0.10R. That is $304 per trade versus $37 per trade at the same risk, and the compressed half is negative after fees on a $50k account trading round lots.
The pullback trades also averaged 6.5 days held against 2.9 days for the breakouts. On a per-day basis the gap narrows sharply, which matters when your capital is finite and margin is being consumed. That comparison is the whole argument in what swing trading pays per day of exposure.
If a setup tag holds fewer than 30 closed trades, your win rate by strategy is a rumour: at a true 45% edge, a 30-trade sample lands anywhere between 27% and 63% at two standard deviations, and you will cut a winner or fund a loser on that noise.
Mistakes that keep showing up in setup reviews
Comparing setups in dollars across a sizing change. A setup that looks stronger often just got traded bigger. Only R-multiples survive that comparison.
Tagging after the outcome is known. Traders relabel a losing pullback as a "failed breakout" and contaminate both tags. Tag at entry, never at exit.
Counting time-stop exits as losses. They are a separate category. A setup with 40% of its trades exiting on time is telling you the target is wrong, not that the entry failed.
Adding a fifth setup while three are unmeasured. Every new tag divides an already thin sample and pushes statistical clarity another six months out.
Ignoring the invalidation level in the definition. Without one, two traders taking the same trigger produce different R-multiples and neither number means anything. This is the exact gap covered in the difference between a journal and a trade log.
Where the tooling does the work
None of this analysis is hard. It is just tedious enough that nobody does it by hand past the second month. TradeOlogy connects to a brokerage account or takes a CSV, rebuilds executions into round trips, and reports expectancy, profit factor, win rate and drawdown broken down by setup tag, by session and by hour across stocks, options, futures and crypto.
The practical value is filtering. Tag your entries at the point of execution, then read performance by setup with the sub-30-trade tags flagged as unresolved rather than ranked. The equity curve for a single tag, viewed alone, tells you in seconds whether the setup is grinding upward or riding one outlier. Pair that with the expectancy calculation per tag and the decision to cut or size up stops being a feeling. The free trial requires a card and you can cancel anytime.
For a structured way to run the whole evaluation, including the outlier-removal test, see how to properly evaluate a trading strategy.
FAQ
How many trades does a setup need before the win rate means anything?
Thirty closed trades is the working floor, and 100 is where the confidence interval gets tight enough to size against. At 30 trades a 45% true win rate can print anywhere from 27% to 63%. Treat anything below 30 as unresolved and keep risk flat on it.
Why does the same setup work on one stock and fail on another?
Usually volatility regime rather than the ticker. Split the trades by entry-day ATR against each instrument's own 60-day median and the difference typically appears there, not in the symbol. If the gap holds above 0.5R, you have a filter, not a coincidence.
Should I keep a setup with positive expectancy but a 32% win rate?
Yes, if the sample is 30+ and the top winner is not carrying the whole result. A 32% win rate at 2.6R average win produces 0.15R expectancy, which is thin but real. Expect eight-loss streaks and size so that a run of them costs under 10% of the account.
Does hold time change which setups are worth trading?
It changes the ranking. A 0.43R setup held 6.5 days returns 0.066R per day, while a 0.15R setup held 2.9 days returns 0.052R per day — much closer than the headline numbers suggest. When capital or margin is the constraint, R per day of exposure decides allocation.
Verdict
Swing trading setups do not earn their place in your book because they look clean on a chart — they earn it with 30+ closed trades, expectancy stated in R, and a volatility split that proves the edge is not confined to one half of the sample. Tag at entry, measure per day of exposure, and cut anything under 0.15R. The setups you feel best about are usually the ones the data has already retired.