

Swing trading risk management is the set of rules that caps loss on each position and across the whole book held overnight, sized so that a normal cluster of losers plus one gap through a stop still leaves the account tradable. Most swing traders size off the stop distance and stop thinking. That works until a Tuesday morning print opens 9% below your stop, and the 1% loss you budgeted arrives as 1.8%, on three correlated positions at once. The drawdown that ends swing accounts does not bleed in. It shows up in a single opening auction.
Why swing traders under-price overnight exposure
The standard rule says risk 1% per trade, place the stop below structure, divide and size. That arithmetic assumes your stop is a real exit price. On a multi-day hold it is a request, not a fill.
Equities trade roughly 6.5 hours and sit closed for 17.5. News, guidance cuts, sector downgrades and index rebalances all land in that window. When price reopens below your stop, you exit at the market, and the loss is whatever the book gives you. Traders record that as one losing trade in the journal. It is not one losing trade. It is a loss with a different distribution than every other loss in the sample, and it belongs in its own bucket.
The consequence shows up in expectancy. If your model assumes a 1.0R average loss and your realized average loss is 1.25R, your expectancy is overstated by more than the edge you thought you had. Run the numbers on a 45% win rate at 2R targets: planned expectancy is 0.35R per trade. Substitute a 1.25R average loss and it drops to 0.21R. Same setups, same discipline, 40% less money for the same screen time.
The metric that actually governs your swing drawdown
Two numbers control how deep your position sizing lets a drawdown run. Neither is your stop distance.
The first is realized R on losers. Pull every losing trade and divide the actual dollar loss by the dollar risk you planned at entry. Average it. On a clean intraday book that number sits near 1.02R. On a swing book with overnight exposure it commonly lands between 1.15R and 1.35R, and the gap-through subset alone runs 1.4R to 1.9R.
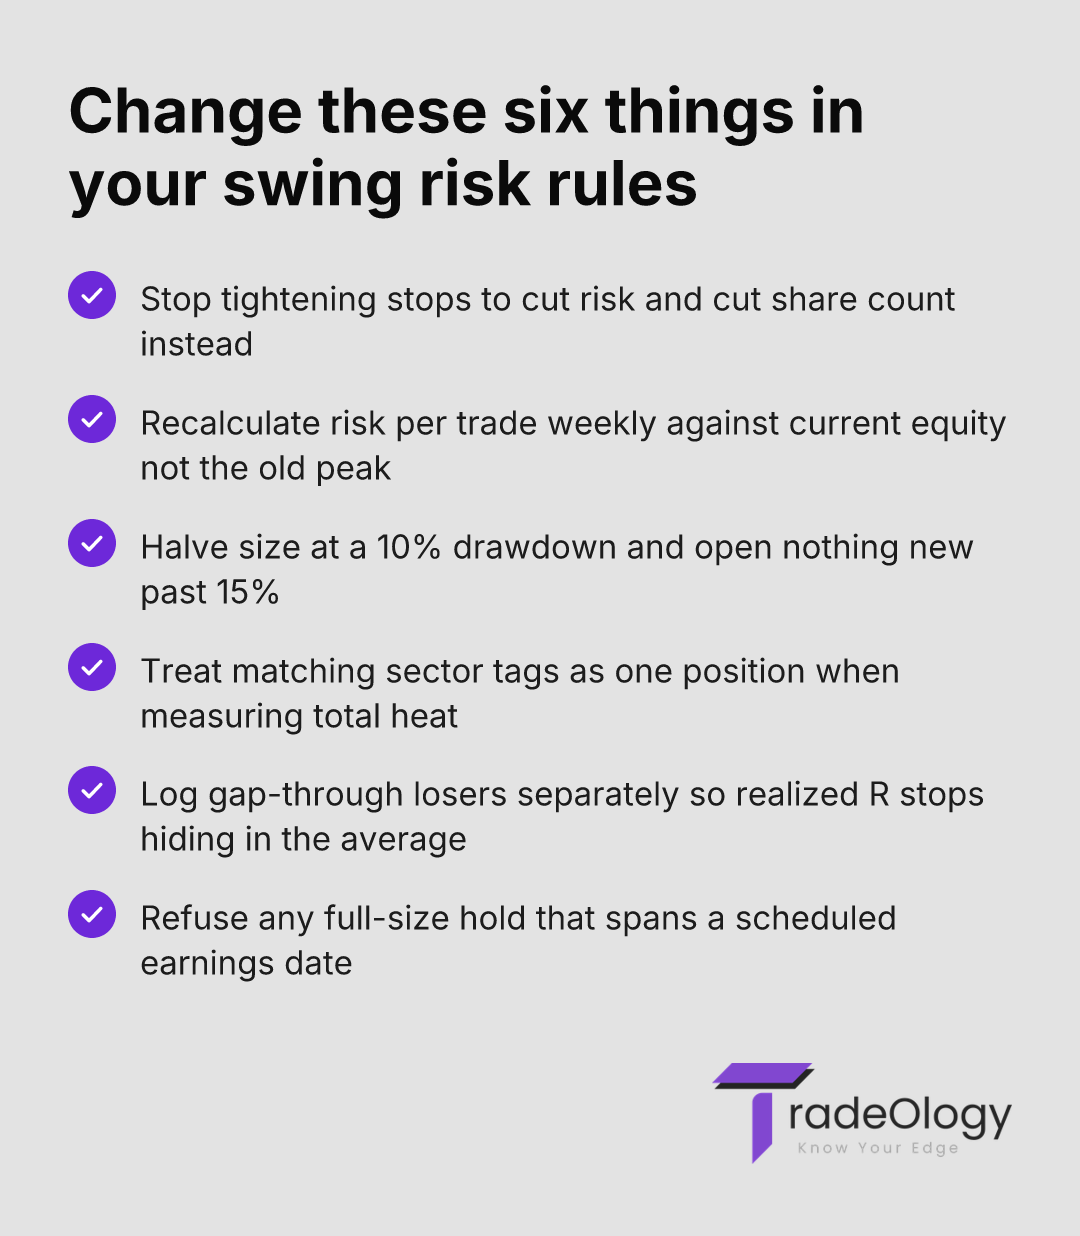
Now the part that contradicts the usual advice. Bucket those losers by stop distance in ATR. The sub-1-ATR bucket shows a higher realized R than the 2-ATR bucket, because a tight stop sits inside the range that a routine overnight gap covers. Tightening a stop on a three-day hold does not reduce risk. It converts a defined 1R loss into an undefined one and hands the sizing decision to the opening auction. If you want smaller risk, cut share count, not stop distance.
The second number is correlated heat. Four semiconductor longs at 1% each are not four trades. They are one 4% bet on one factor, and gap slippage takes the tail past 6%. Your max drawdown is not driven by risk per trade at all. It is driven by risk per trade multiplied by the number of positions that move together, multiplied by realized R. That product is the only sizing figure worth watching.
A sizing process for gaps and thin overnight books
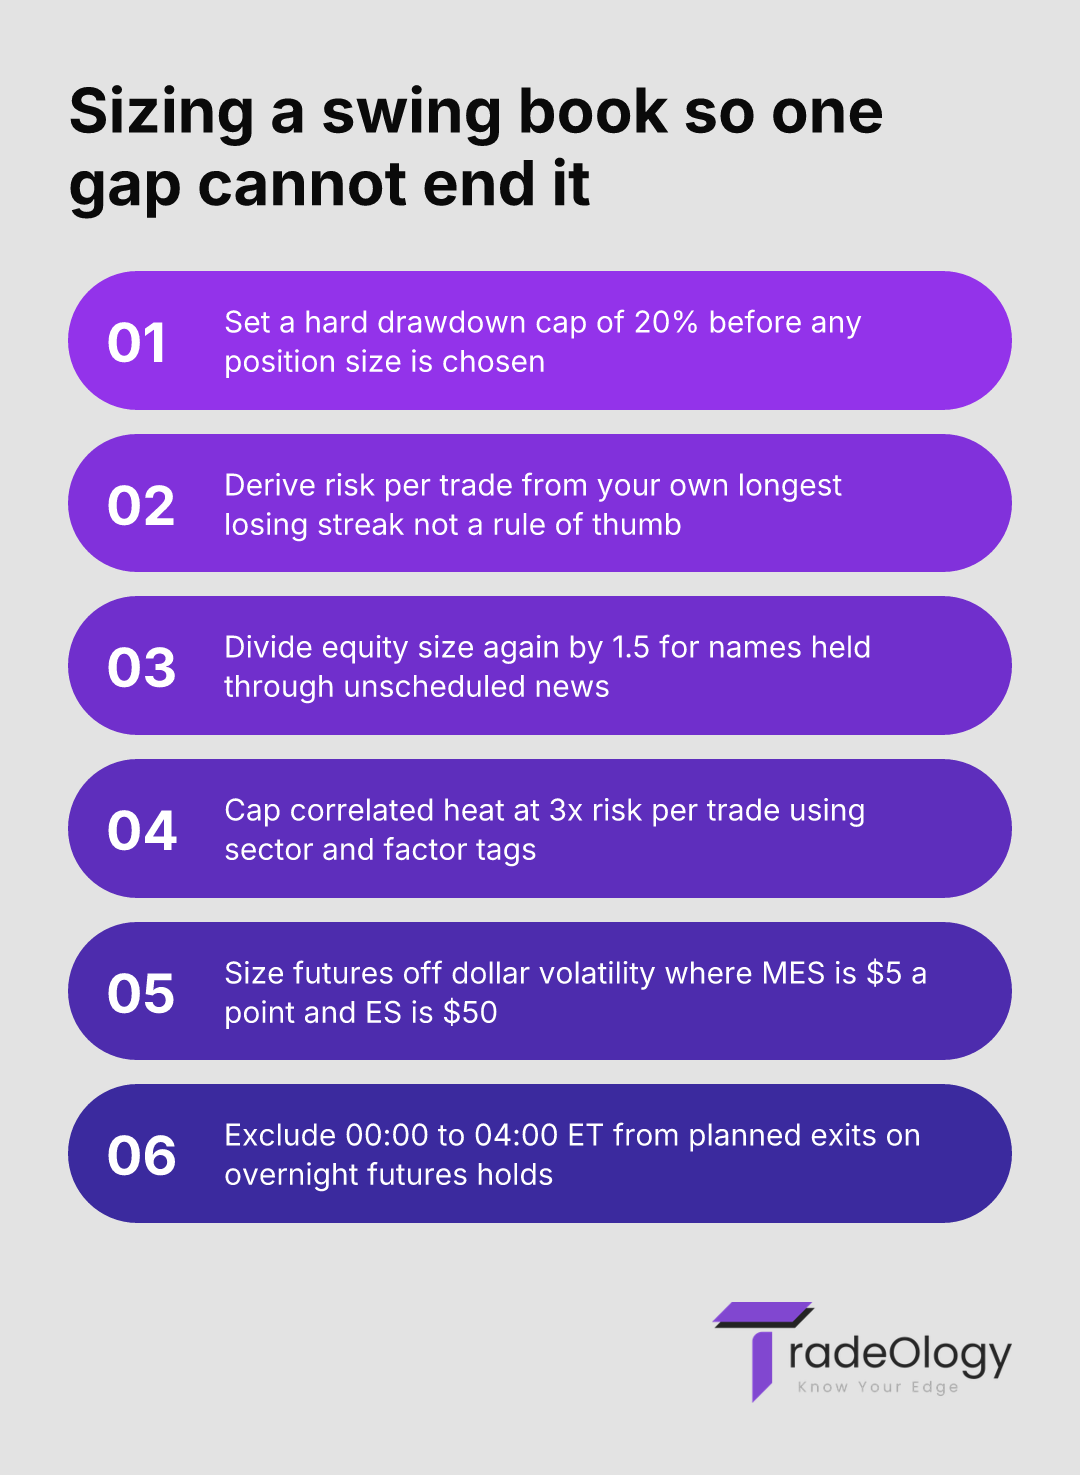
Rebuild the sizing calculation in this order. Every step is checkable against your own trade history.
Set the account-level cap first. Decide the maximum peak-to-trough drawdown you will accept before you cut size. 20% is defensible. 30% needs a 42.9% gain to recover and usually ends the strategy instead.
Derive risk per trade from that cap. Take your longest historical losing streak from your own data, not a rule of thumb. Nine consecutive losers at 1.25R realized is 11.25% gone. That fits inside a 20% cap with room for one gap event. Twelve losers at 2% risk does not.
Apply a gap multiplier to equities. Divide target risk by stop distance, then divide again by 1.5 for names held through unscheduled news windows. Skip earnings entirely or use 2.5, which usually prices you out of the trade — which is the point.
Cap correlated heat at 3x risk per trade. Tag each open position by sector or factor. When two tags match, treat the pair as one position for the cap.
Size futures off dollar volatility, not contract count. An ES point is $50 and an MES point is $5, per CME contract specs. On a 55-point stop that is $2,750 versus $275 of risk. Micros exist so you can hold a swing stop without oversizing.
Exclude the 00:00–04:00 ET window from planned exits. Overnight futures books thin out, and realized loss in that window runs wider than the same stop hit during the cash session.
Setup checklist
Calculate realized average loss in R across all closed losers, then compare it to your planned 1.0R.
Filter losing trades by stop distance in ATR and confirm whether the tight-stop bucket slips more.
Tag every position by sector or factor and cap total correlated heat at 3x risk per trade.
Eliminate any hold that spans a scheduled earnings date unless size is cut by at least 60%.
Review your worst single-day loss against risk per trade — a ratio above 2.5 is a correlation failure, not variance.
Reading your own sizing data
Metric | What it actually means | Action to take |
|---|---|---|
Realized average loss above 1.2R | Your stops are not your exits, so stated risk per trade is fiction. | Cut share count by the same percentage your losses overrun. |
Worst day > 2.5x risk per trade | You hold one factor bet split across several tickers. | Cap correlated heat at 3x and treat matching tags as one position. |
Max drawdown > 20% with profit factor above 1.4 | The edge is fine and the sizing is too large for the streak length. | Halve risk per trade until drawdown fits inside your cap. |
Standard deviation of dollar risk above 40% of the mean | You size by conviction, so one trade dominates the equity curve. | Fix dollar risk per trade and let stop distance set share count. |
Gap-through losers > 15% of all losers | Stops sit inside the routine overnight range. | Widen stops to 2 ATR and reduce size to hold the same dollar risk. |
Worked example: one $60,000 book, stocks and futures
Account: $60,000. Risk per trade: 1%, or $600. Drawdown cap: 20%, so $12,000.
The equity leg: entry $48.20, structural stop $45.90, so $2.30 of risk and 260 shares. Textbook. Four days later the name gapped on a supplier warning and filled at $44.05. Loss: $1,079, or 1.80R. Not a mistake in trade selection — a mistake in assuming the stop was an exit.
The futures leg the same week: two MES contracts with a 55-point stop, $275 per contract, $550 total risk. That stop got hit in the cash session and filled within a point. Realized loss 1.04R. Same rule, two very different distributions, which is exactly why the futures side of the journal needs its own sizing column.
The real damage was the book. Three of the five open equity longs shared a sector tag. Stated heat was 3%. Gap-adjusted heat was 5.4%. A single morning removed 4.1% of the account, and the trader logged it as "choppy tape". Nothing about the tape was involved. The sizing decided that outcome nine days earlier.
If your worst single-day loss is more than 2.5 times your stated risk per trade, you do not have a variance problem. You have several copies of the same trade open, and the overnight session priced them together.
Mistakes that turn a 12% drawdown into 30%
Adding to a loser on day two. The average size grows while the thesis weakens. Every scaled-in swing loser I have reviewed shows realized loss above 2R.
Sizing off account equity at the peak. After a 15% drawdown, 1% of the original balance is 1.18% of what remains. Recalculate risk weekly against current equity.
Holding through earnings at full size. A binary event does not respect a structural stop. Either cut to a third or stand aside.
Counting positions instead of factors. Five tickers, one beta. The setup tag tells you which trades actually pay, and the sector tag tells you whether you are diversified or repeating.
Judging risk by hold time instead of exposure. A four-day hold carries four overnight sessions of unhedged risk, which is why return per day of exposure beats raw win rate as a comparison metric.
Where TradeOlogy fits
None of this needs new software to understand. It needs your fills grouped correctly. TradeOlogy builds round trips from a connected brokerage account or an imported CSV across stocks, options, futures and crypto, then reports expectancy, profit factor, win rate and drawdown broken down by setup, session and hour.
The specific views that matter here: realized loss per trade against planned risk, so the gap-through subset separates from the clean stops; the drawdown curve against your 20% cap; and hourly breakdowns that expose whether your losses cluster at the open or in thin overnight futures hours. Tag by sector and the correlated-heat problem becomes visible instead of theoretical. If your log currently lives in a spreadsheet, the gap is usually structure rather than effort — see why a trade log is not a journal. The free trial requires a card and you can cancel anytime.
FAQ
How much should I risk per trade if I hold swing positions through earnings?
Treat an earnings hold as a 2.5R loss scenario rather than 1R, and size so that outcome still fits your drawdown cap. On a $60,000 account with a 1% budget, that means about $240 of nominal risk instead of $600. Most traders find the resulting share count too small to bother with, which is the correct conclusion.
Why is my max drawdown three times larger than my risk per trade?
Because your open positions correlate. Risk per trade only bounds a single loss; drawdown is bounded by risk per trade times the number of positions moving together times realized R. Tag by sector and factor, then cap total correlated heat at 3x your per-trade risk.
Do tighter stops reduce overnight exposure on swing trades?
No. A stop inside 1 ATR sits inside the range a routine overnight gap covers, so it gets skipped rather than filled. Bucket your own losers by stop distance in ATR and you will usually find the tight bucket has the higher realized R. Reduce size to lower risk, not stop distance.
How do I size stock and futures swing trades from the same risk budget?
Convert both to dollars at risk before comparing anything. Shares times stop distance for equities; contracts times point value times stop points for futures, where ES is $50 per point and MES is $5. Then apply a gap multiplier to the equity leg only, since futures trade nearly around the clock and fail through slippage rather than gaps.
What drawdown level should force a size reduction?
Halve risk per trade at 10% below your equity peak and stop opening new positions at 15%. A 20% drawdown needs a 25% gain to recover and a 30% drawdown needs 42.9%, so the cut has to happen while recovery math is still reasonable.
The swing trading risk management standard worth holding
Set one number this week: the maximum drawdown you will accept before you cut size. Then work backwards through your own longest losing streak, your own realized average loss, and your own correlated heat until the arithmetic fits under that ceiling. If it does not fit, the position size is wrong — the setups are not the problem. Reviewing your fills properly takes an evening; rebuilding a 30% drawdown takes a year.
Verdict: Swing trading risk management fails at the portfolio level, not the trade level, because gaps overrun stops and correlated positions loss together. Size off realized R and correlated heat, cap total exposure at 3x per-trade risk, and your worst day stops being an account event.