

Intraday margin excess is account equity minus the total intraday margin requirement on open positions, calculated at the broker's day-trade rate rather than the overnight initial margin. Most traders who learn how to calculate intraday margin excess stop at that number and treat the remainder as spending money. That is where accounts break. Excess describes what your broker will permit, not what your stop distance can absorb, and the two figures are rarely within an order of magnitude of each other.
Why traders read margin excess as permission
Ask a futures trader what their risk is on eight ES contracts and you will often hear "$4,000" — the day margin the broker posted. That is not risk. That is a deposit. The actual exposure is $400 per index point, and a routine 12-point adverse swing costs $4,800 on a $33,800 account. Nothing about the margin figure warned about that.
The second failure is timing. Broker day-trade rates exist only during the intraday window. At the cutoff, usually around 3:15 CT for equity index futures, the platform recalculates against exchange initial and maintenance margin. Positions that looked comfortably funded five minutes earlier become a liquidation event. The trader did not get stopped out. The margin engine flattened them at the worst available price.
The third failure is arithmetic. Unrealized profit inflates account equity, which inflates excess, which invites another position. When the open trade reverses, both the equity and the excess fall at once, and the size that felt justified was never funded by anything real.
How to calculate intraday margin excess, component by component
Three inputs, one subtraction. The precision matters because each input moves during the session.
Account equity
Cash balance plus open trade equity. Futures accounts mark to market continuously, so unrealized P&L is already inside the equity figure. For a stock or options account, use the marked value of the positions plus cash minus any debit balance.
Intraday margin requirement
Contracts multiplied by the broker's published day margin rate. Rates vary by firm and by product, and brokers raise them without much notice around high-volatility events. Through 2026 several firms have kept intraday index-futures rates at a fraction of exchange minimums, which widens the gap between excess and real exposure. Exchange performance bond requirements are the figure that actually governs your position after hours.
The margin excess formula
Intraday margin excess = account equity − intraday margin requirement. Then run the same subtraction against overnight initial margin. The second result is the number that decides whether you can hold. If it is negative, your position has an expiry time regardless of your setup.
The five-step review that stops margin from setting your size
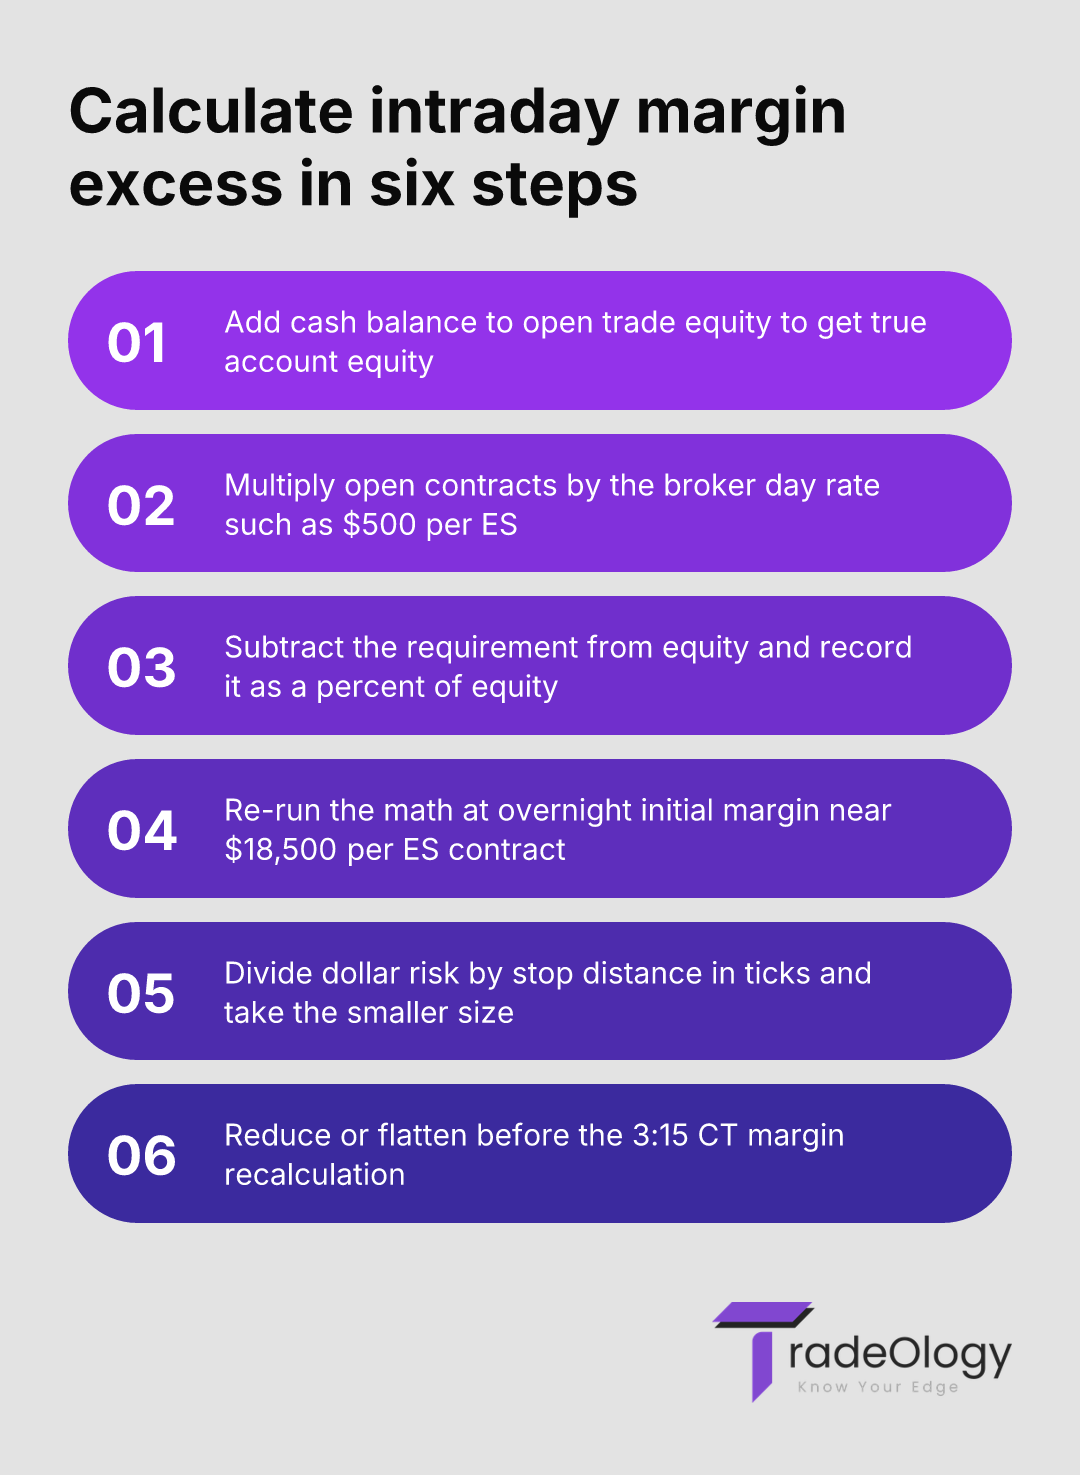
Pull the cash balance and add current open trade equity. That is your true account equity, not the buying power line.
Multiply open contracts by the broker's day margin rate. Eight ES at $500 is $4,000.
Subtract to get intraday margin excess. Record it as a percentage of equity, not as a dollar figure.
Re-run step 2 with exchange initial and maintenance margin. Compare the result to equity before 3:00 CT.
Size independently. Divide dollar risk per trade by stop distance in ticks, and take the smaller of that number and the margin-permitted number.
Step 5 is the one traders skip, and it is the only step that touches expectancy. Position sizing derived from stop distance and account equity produces a stable R-multiple. Sizing derived from available margin produces a random one.
Setup Checklist
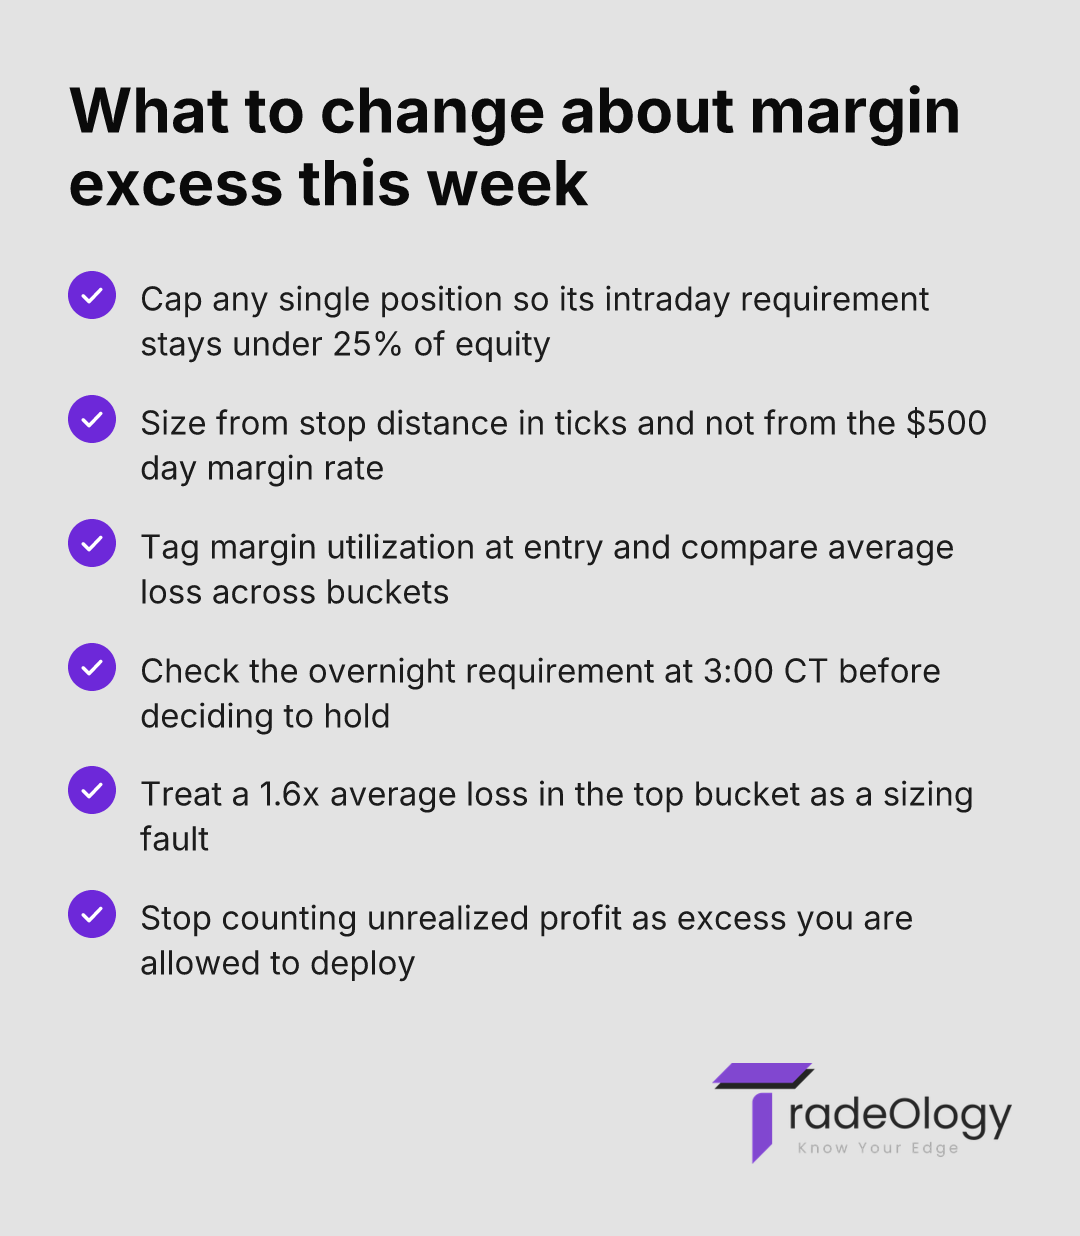
Calculate intraday margin excess as a percentage of account equity at every entry, not in dollars.
Compare the overnight maintenance margin requirement against equity before 3:00 CT on any position you intend to hold.
Tag each round trip with margin utilization at entry in buckets of under 25%, 25-50%, and over 50%.
Filter your journal by those buckets and compare average loss and expectancy across them.
Eliminate any position whose intraday requirement alone exceeds 25% of equity, regardless of conviction.
What each margin reading is actually telling you
Metric | What it actually means | Action to take |
|---|---|---|
Intraday margin excess below 25% of equity | The liquidation engine owns your exit, not your stop. | Cut contracts until the requirement sits under a quarter of equity. |
Margin utilization above 50% at entry | Size came from buying power instead of stop distance. | Recompute size from dollar risk divided by stop in ticks. |
Overnight requirement above equity at 3:00 CT | The position has a forced exit time attached to it. | Reduce or flatten before the intraday rate expires. |
Average loss 1.5x larger in the high-utilization bucket | Tail risk is concentrated in margin-driven exits. | Cap the bucket and re-measure expectancy after 30 trades. |
Flat win rate with a falling equity curve | Sizing fault, not a setup fault. | Keep the setup, halve the contract count. |
Worked example: $35,000 account, eight ES contracts
Cash balance $35,000. Long 3 ES from 6,480, currently 6,472. That is minus 8 points at $50 per point across 3 contracts, so open trade equity is minus $1,200. Account equity: $33,800.
Broker day margin is $500 per contract, so the intraday requirement is $1,500. Intraday margin excess: $33,800 − $1,500 = $32,300. Divide that by $500 and the platform will let this trader hold 67 contracts.
They add five more, reaching eight. Requirement $4,000, excess still $29,800, and the buying power line looks untouched. Now run the second calculation. Exchange initial margin near $18,500 per contract puts the overnight requirement at $148,000 against $33,800 of equity. Maintenance margin at roughly $16,800 per contract is $134,400. The position is short by more than $100,000 the moment the intraday window closes.
The risk math is worse. Eight contracts is $400 per point. A 1% risk budget of $338 with a 10-point stop supports 0.68 of one ES contract. Margin said 67. Stop distance said one. The trader took eight and called it a scale-in.
If any single position's intraday margin requirement exceeds 25% of your account equity, your stop is decorative — the broker's liquidation engine already owns the exit, and it will not wait for your level.
The finding that shows up in the journal, not the margin window
Here is the part that contradicts the usual advice about leverage. Sort your round trips by intraday margin utilization at entry and the win rate barely moves. In journals I have reviewed, the sub-25% bucket and the over-50% bucket sit within about 2 percentage points of each other. Traders see that and conclude size is not the problem.
The damage is entirely in the loss distribution. Average loss in the high-utilization bucket runs roughly 1.6 times the low-utilization bucket, because that is where forced exits, held-to-cutoff trades and averaging-down clusters live. A trader with a 55% win rate, a 1.2R average win and a 1.0R average loss carries an expectancy of about 0.21R. Inflate the average loss to 1.6R and expectancy drops to roughly minus 0.06R at the same win rate. Nothing about the setup changed. The margin decision changed the tail, and the tail is where expectancy is decided.
This is falsifiable in your own data. If your average loss is flat across margin-utilization buckets, ignore this section. If the top bucket is 1.4x or worse, you do not have a setup problem and no amount of strategy evaluation will find it, because the strategy is fine at small size.
Mistakes that keep repeating
Counting unrealized profit as excess. A $2,000 open gain funds a new position, then reverses, and both legs are now underwater against a smaller equity base.
Assuming day margin is static. Brokers raise intraday rates ahead of CPI prints and FOMC. A rate change from $500 to $2,500 per contract can eliminate your excess while you are holding.
Confusing day-trading buying power with margin excess on stock accounts. Under FINRA Rule 4210, a pattern day trader's buying power is four times maintenance margin excess at the prior day's close — a fixed figure, not a live one.
Adding to a loser. The addition raises the requirement while the open loss lowers equity. Excess falls from both ends, which is exactly the behavioural pattern visible in revenge trading data.
Measuring excess once, at 9:35 ET. The number that matters is the one at 3:10 CT, when the requirement is about to change.
Where the journal does the work
Margin excess is a live number, so a broker screen shows it and forgets it. The relationship between excess and results only appears across a few hundred round trips. TradeOlogy rebuilds executions from a connected brokerage account or a CSV import into round trips for stocks, options, futures and crypto, which gives you contract count, entry time and result on every trade in one place.
From there the work is filtering. Tag utilization buckets, then compare expectancy, profit factor and average loss across them. Check the session and hourly breakdown for a cluster of exits in the final 20 minutes before the intraday cutoff — that histogram bar is your forced-liquidation signature, and it usually carries the worst average R in the book. Analytics broken down by setup and by hour turns a margin habit into a measurable line item. The trial is a card-on-file trial and you can cancel anytime.
FAQ
Why does my intraday margin excess collapse minutes before the close?
Because the broker stops applying the day-trade rate and starts applying exchange initial margin, typically around 3:15 CT for index futures. An eight-contract ES position moves from a $4,000 requirement to roughly $148,000. If equity cannot cover it, the platform liquidates rather than issuing a call.
Does unrealized profit count toward intraday margin excess?
In a futures account, yes, because open trade equity is marked to market inside the equity figure. That is precisely why it is dangerous to size off it. Treat excess funded by an open gain as provisional and re-check it after the position closes.
How much intraday margin excess should I keep relative to account equity?
Keep the requirement on any single position under 25% of equity, which leaves excess above 75%. That threshold is where average loss size starts inflating in most journals. It is a sizing rule, not a comfort preference.
Is day-trading buying power the same as intraday margin excess on a stock account?
No. Day-trading buying power is four times the maintenance margin excess at the prior session's close and stays fixed all day. Intraday margin excess in a futures account recalculates tick by tick as equity moves.
Can a wider stop fix a low margin excess reading?
A wider stop reduces the odds of a random exit but increases dollar risk at the same contract count. If excess is thin, cut size first and then choose the stop. Reversing that order is how traders end up with a stop the account cannot afford to honour, a pattern worth logging in your trade journal.
Run the second calculation before the first one flatters you
Knowing how to calculate intraday margin excess is one subtraction. Knowing that the same position carries a second, much larger requirement a few hours later is what separates a funded trade from a scheduled liquidation. Run both numbers, then let stop distance pick the size.
Verdict: Intraday margin excess measures broker permission, not risk, and traders who size from it lose expectancy through inflated average losses while their win rate stays intact. Calculate excess against both the day rate and overnight maintenance margin, cap any single position at 25% of account equity, and size from your stop.