

A gold futures drawdown is the peak-to-trough fall in account equity while trading GC or MGC contracts, and because one full-size GC contract moves $100 per dollar of gold, a 10-point adverse swing on one contract strips $1,000 out of equity. That dollar figure is what traders feel. It is also the figure that tells them the least. Gold's daily range in 2026 sits roughly double where it was in 2023, so an unchanged setup with an unchanged stop in ATR terms now throws off a dollar drawdown that looks like a broken strategy. Most traders respond by killing the strategy. The data almost always says kill the contract count instead.
Why a gold futures drawdown reads worse in dollars than in R
Traders benchmark pain against their last calm quarter. In 2023 a five-point stop on GC cost $500 and gold's average daily range gave that stop room to work. Gold's run through $4,000 changed the denominator, not the strategy. A structural stop behind the same swing low now sits 12 points away, and 12 points on one GC contract is $1,200.
The trader did not change risk per trade on purpose. The market changed it for them. On a $50,000 account, risk went from 1.0% to 2.4% without a single decision being made. Six losses in a row is a completely ordinary outcome for a 45% win-rate system. At 1% that sequence costs $3,000. At 2.4% it costs $7,200, and the equity curve shows a 14.4% hole instead of a 6% one.
Then comes the second mistake. The trader looks at the dollar hole, decides the edge is gone, and drops to a smaller size or steps aside entirely. The recovery leg then runs at a third of the size that dug the hole. Nothing about the setup failed. The measurement failed, and the response to the measurement cost more than the drawdown did.
Depth in R, velocity in sessions
Two numbers separate a volatility problem from an edge problem, and neither of them is denominated in dollars.
The first is max drawdown in R. Convert every trade to an R-multiple against the risk you actually assumed at entry, then run peak-to-trough on the R series. If your worst historical stretch was -8.2R and this year's worst stretch is -8.5R, your edge is intact. The strategy is producing the same losing sequences it always produced. Only the dollar translation changed.
The second is time-to-trough, measured in trading sessions from equity high to equity low. This is the number nobody tracks and the one that explains the emotional damage. In a 2023-style tape, an -8R stretch unfolded over roughly 17 sessions with quiet days between losses. In 2026 gold volatility, the same -8R arrives in six sessions, sometimes four. Same math, three times the velocity.
That compression is the whole story. Traders do not abandon systems because of drawdown depth. They abandon them because of drawdown speed, and speed is a pure function of gold volatility, not of whether the setup still works. If you have never separated those two variables, your strategy evaluation process is measuring the market's mood and calling it your edge.
How to measure a gold futures drawdown properly
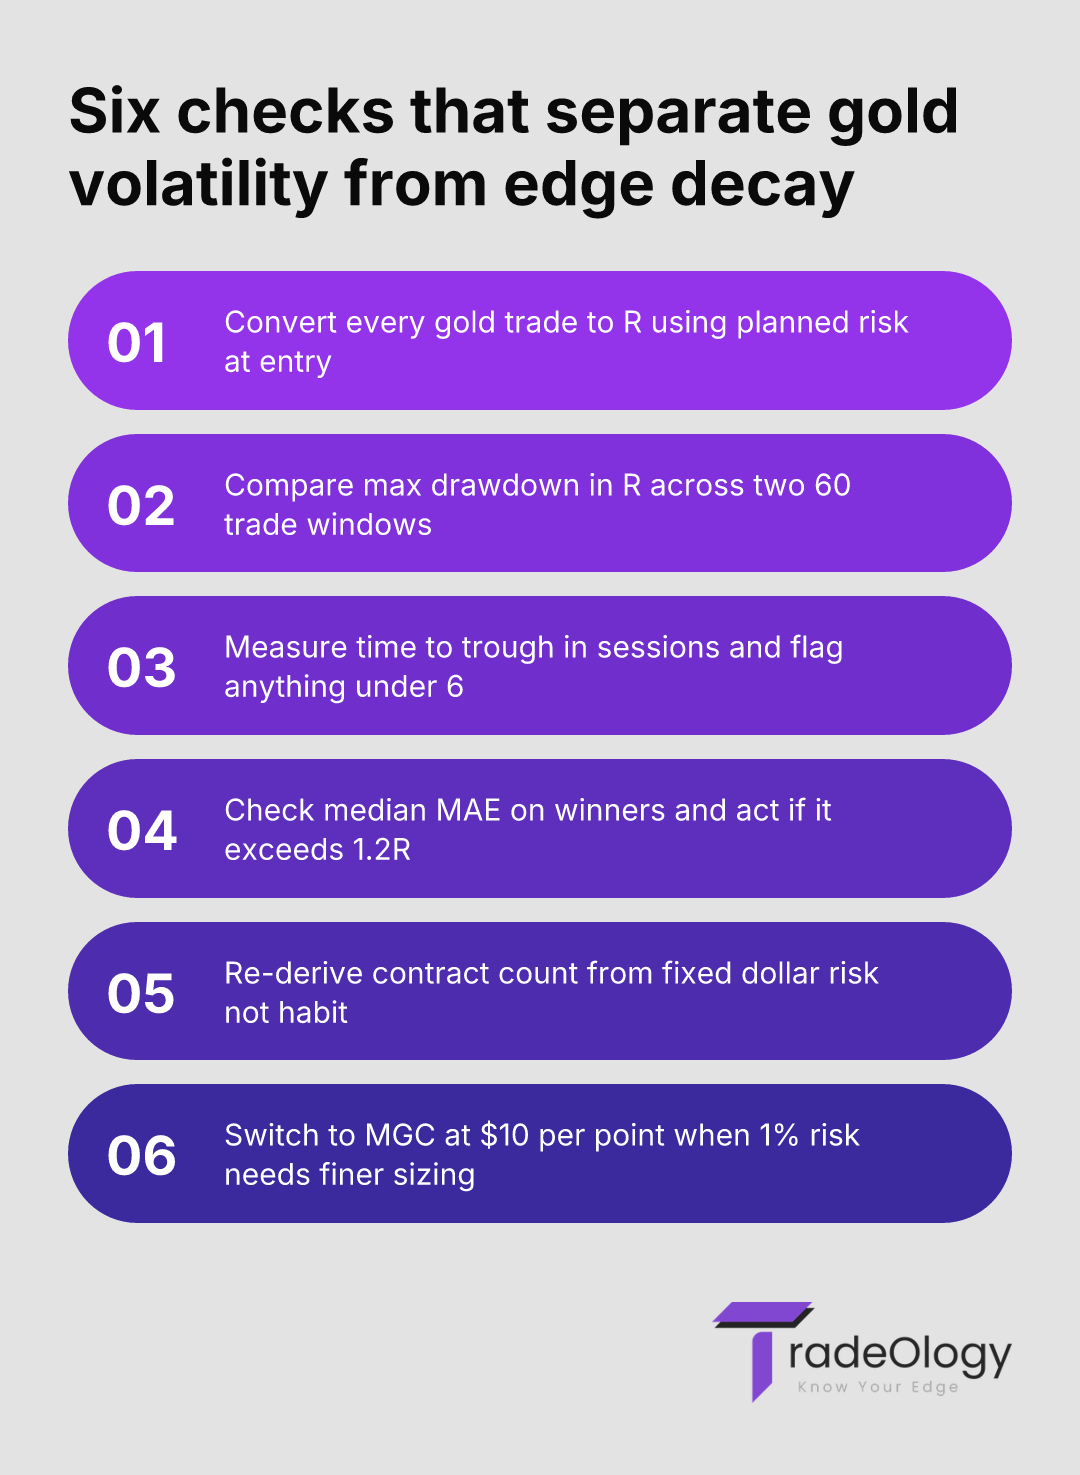
Run this on your last 120 gold round trips before you touch anything else in the strategy.
Calculate R for every gold trade using planned risk at entry, not realised dollars, so slippage and partial fills stop distorting the series.
Compare max drawdown in R against max drawdown in dollars across two 60-trade windows, one before and one after gold's ATR expansion.
Tag each trade with the 20-day ATR bucket it was taken in, then filter for the bucket where win rate drops under 40%.
Review maximum adverse excursion on winners, and if median MAE on winning trades exceeds 1.2R, your stop is too tight for the current range.
Eliminate the contract count you inherited from a quieter tape and re-derive it from a fixed dollar risk per trade.
Step four is the one traders skip. MAE on winners is the cleanest read on whether gold's range has outgrown your stop. When trades that eventually pay you are routinely dipping 1.3R underwater first, you are not getting stopped by the thesis being wrong. You are getting stopped by noise you priced for a different market. Full contract specifications and tick values are published by CME Group, and the micro contract is where most of this gets fixed.
Metric to meaning
Metric | What it actually means | Action to take |
|---|---|---|
Dollar drawdown up 60%, R drawdown flat | Gold volatility expanded and your contract count did not adjust. | Rebuild position size from fixed dollar risk, keep the setup. |
Max drawdown in R deeper than any prior window | The edge itself is degrading, not the tape. | Cut the lowest-expectancy setup tag before adding size back. |
Time-to-trough under 6 sessions | Losses are clustering fast enough to break discipline mid-sequence. | Pre-commit a daily loss cap in R and hold contract count constant. |
Median MAE on winners above 1.2R | Your stop is sized for a range gold no longer trades in. | Widen the stop in ATR terms and reduce contracts to hold risk flat. |
Profit factor steady near 1.4, Sharpe ratio falling | Same net return arriving through a far noisier equity curve. | Drop risk per trade to 0.75% until return dispersion normalises. |
A worked example on a $50,000 account
Trader runs one gold breakout setup, 45% win rate, average winner 1.9R, average loser 1.0R. Expectancy is +0.31R per trade. On paper that is a healthy system, and the expectancy math holds regardless of what gold is doing.
In the quiet tape, the stop sat five points behind structure. One GC contract meant $500 at risk, exactly 1% of the account. Worst drawdown across 120 trades was -8.2R, or $4,100, spread over 17 sessions.
Gold's 20-day ATR then expanded from roughly $42 to $88. The same structural stop moved out to 12 points. The trader kept trading one GC contract. Risk per trade became $1,200, or 2.4%. Six losses inside nine sessions produced a $7,200 drawdown, 14.4% of the account, requiring a 16.8% gain to recover.
In R terms that sequence was -6.0R. Well inside the historical -8.2R. The system did exactly what the system does. The account took 2.4 times the intended damage because contract granularity was wrong, and the trader then halved size at the trough, stretching a normal recovery from four weeks to twelve.
The fix costs nothing. Twelve points on MGC is $120 per contract. Four micros put $480 at risk, 0.96% of the account, with the wider stop intact. Same setup, same thesis, same expectancy, drawdown back in its historical range.
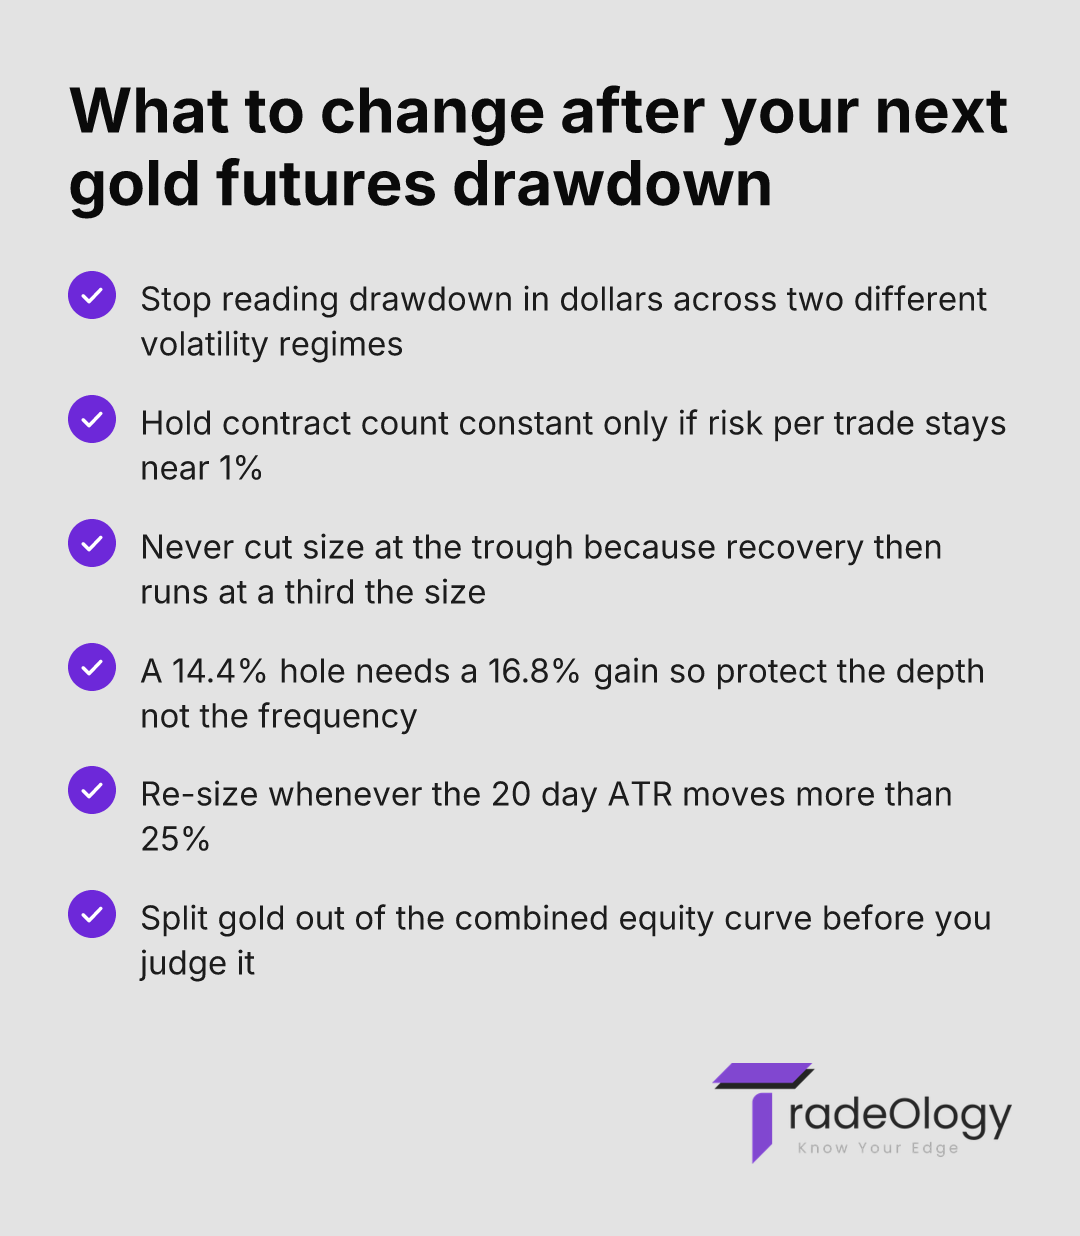
If your dollar drawdown grew more than 50% while your max drawdown in R stayed within one R of its historical worst, your edge is fine and your contract count is wrong. Cutting the setup at that point costs you the recovery, not the loss.
Where traders lose the extra money
Holding contract count constant while ATR moves. Fixed size in a variable-range market is not consistency, it is a floating risk per trade that doubles without a decision.
Judging max drawdown futures performance in dollars across regimes. A $7,200 hole in 2026 and a $4,100 hole in 2023 can be the identical R sequence.
Cutting size at the trough. De-risking after the sixth loss guarantees the recovery runs at reduced size. That single habit is the difference between a four-week and a twelve-week climb back.
Trading GC on accounts under $75,000. At $100 per point, the smallest position already exceeds 1% risk once stops widen past 7.5 points on a $50,000 account.
Blending gold into a combined equity curve. Gold's drawdown profile buried inside a mixed stocks-and-futures curve hides which instrument is actually creating the volatility.
Where TradeOlogy does the work
Converting 120 executions into clean round trips, then into an R series, then into a peak-to-trough calculation, is not something a spreadsheet survives for long. Connect the futures account or import the CSV and the round trips build themselves, including partial fills and scale-outs that usually break manual logs. That distinction between a real journal and a list of fills is covered in trading journal vs trade log.
The part that matters here is filtering. Isolate gold, split the history into two ATR regimes, and read max drawdown in R for each window side by side. If the R figure holds and only the dollar figure moved, the diagnosis is finished. Session and hour breakdowns then show whether the fast losing clusters concentrate around the London fix or the New York open, which is where gold's range genuinely changes character. Tagging setups the way setup-level analytics requires turns a vague drawdown into a specific tag with a specific hour. Free trial, cancel anytime.
FAQ
Should I switch from GC to MGC when gold's ATR expands?
If a correctly placed stop forces risk per trade above 1.5% of the account on a single GC contract, yes. Micro gold moves $10 per point against GC's $100, giving ten times the sizing granularity. That lets you widen the stop for gold volatility while holding dollar risk flat, which is the entire objective.
Does a faster drawdown mean my edge is decaying?
Not on its own. Compare max drawdown depth in R across two windows of at least 60 trades each. If depth in R is unchanged and only time-to-trough shortened, the tape got faster and your edge did not change. Depth in R exceeding its historical worst by more than 2R is the signal that something structural broke.
How many gold trades before a max drawdown figure means anything?
Below roughly 100 trades, max drawdown is mostly a sample-size artefact. A 45% win-rate system will produce a seven-loss streak inside 100 trades with meaningful frequency. Treat drawdown as a distribution property, not a single worst case, and re-measure every 50 trades.
Why does my profit factor stay flat while my Sharpe ratio drops?
Profit factor ignores the path. Gross profit over gross loss can sit at 1.4 whether the returns arrive smoothly or in violent clusters. Sharpe punishes the dispersion, so a falling Sharpe with a stable profit factor means your per-trade risk is now too large relative to the range you are trading.
Size the gold futures drawdown, do not flinch at it
The standard is simple and it is not negotiable. Every gold trade gets an R value based on planned risk, every drawdown gets measured in R and in sessions, and contract count gets re-derived whenever the 20-day ATR shifts more than 25%. Anything else is letting the exchange multiplier decide your risk per trade. If you also run swing positions in gold, sizing for the gap rather than the stop applies with equal force.
Verdict: A gold futures drawdown measured in dollars tells you what gold did, not what you did. Measure depth in R and time-to-trough, and most of what looks like a broken edge turns out to be a contract count you never updated.