

Position sizing on a small trading account means setting risk per trade as a fixed percentage of current equity, so a $5,000 account risking 1% loses $50 per trade and can absorb a string of losses without a forced cut in size. That is the textbook answer, and on a $5,000 account it collapses within a week. The trader picks 1%, then picks an instrument whose smallest position risks $100 on a normal stop, and the rule quietly becomes 2% before the first trade prints. Nobody writes that down. The losing streak finds it anyway.
Why the 1% rule breaks below $10,000
On a $100,000 account, risk per trade percentage is an input. You choose 1%, and share count or contract count bends to fit it. On a $5,000 account the relationship inverts. The instrument's minimum increment is the input, and your risk percentage is whatever falls out of it.
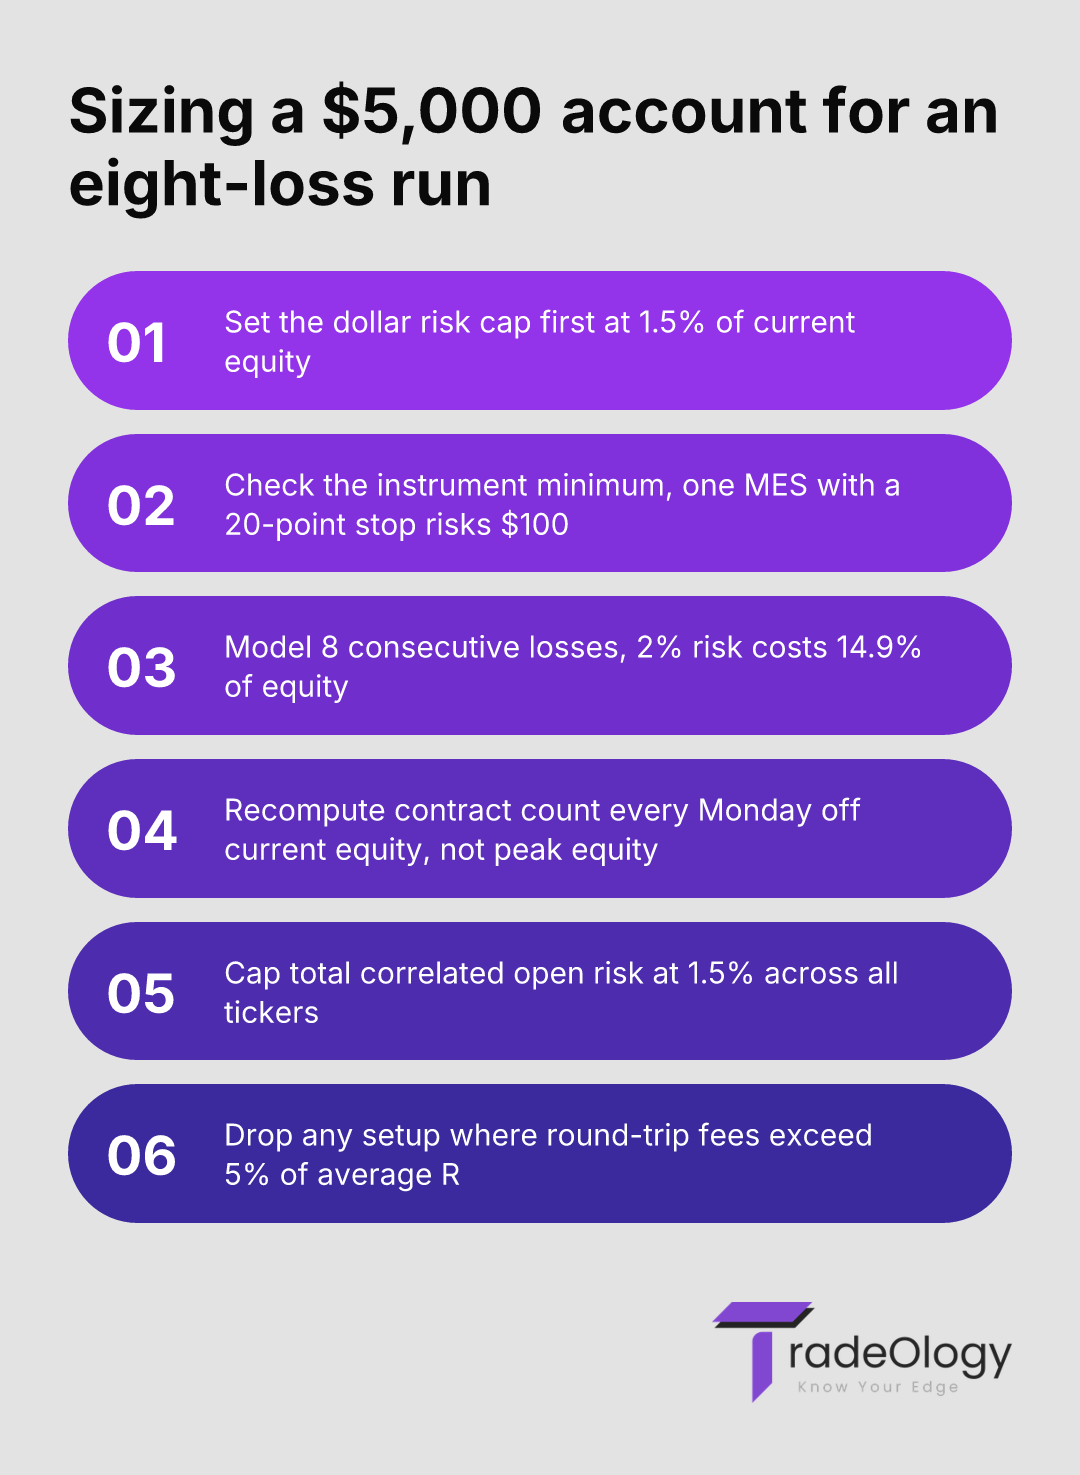
Run the arithmetic. One Micro E-mini S&P 500 contract is $5 per point. A 20-point stop risks $100. That is 2% of $5,000, and it is the smallest trade the instrument allows. MNQ at $2 per point with a 50-point stop is the same $100. Options are worse in granularity terms: one contract on a $4.00 premium is $400 of exposure, and a 50% stop is $200, or 4% of the account.
Equities dodge the increment problem and hit a different wall. A $5,000 cash account sits under the $25,000 pattern day trader minimum, so FINRA's day-trading rules cap you at three day trades in five business days. That constraint pushes most small accounts toward futures and options, which is exactly where the sizing granularity is coarsest.
The risk drift nobody measures
Here is the part that does not appear in the standard sizing article. The damage on a small account is rarely the initial percentage. It is the drift in that percentage while the account is falling.
A trader starts at $5,000 and risks $100 per trade, calling it 2%. Eight losses later the account is $4,150. The contract count has not changed, because nothing about the setup changed. Effective risk per trade is now 2.4%. After a 30% drawdown to $3,500, that same $100 is 2.9%. Position size has become 45% more aggressive relative to equity, and the trader made no decision to do that. The drawdown is now compounding itself faster than the losing streak that started it.
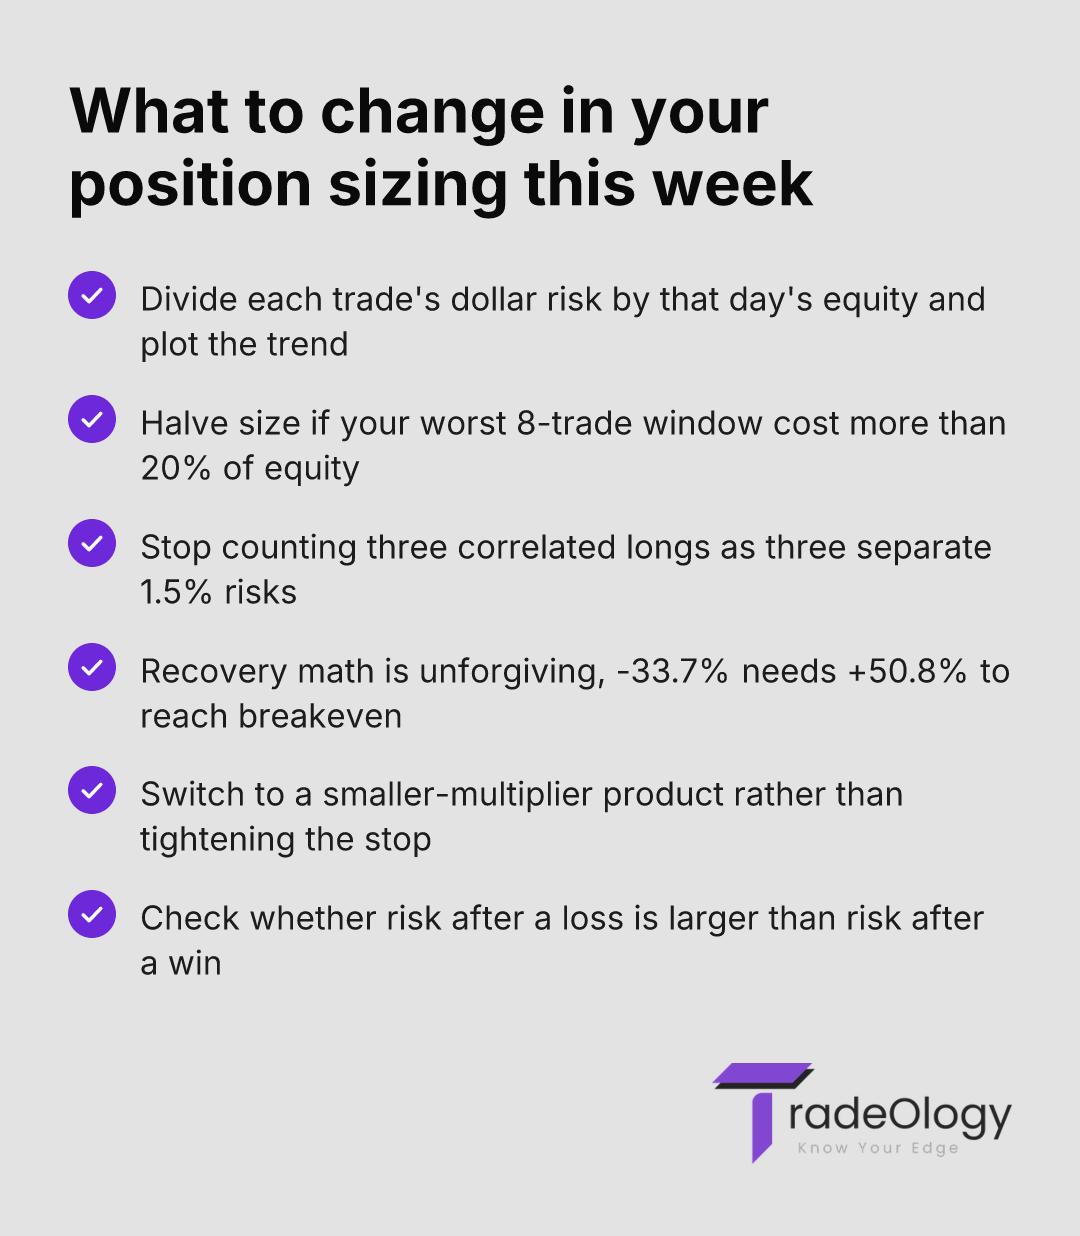
This is measurable and falsifiable in your own data. Divide each trade's dollar risk by the account equity on the date of that trade, then plot the series against your equity curve. If the risk-percentage line slopes up while the equity line slopes down, the strategy is not the problem. The sizing rule stopped being a rule. Most journals never surface this because they store dollar risk and never divide it by anything.
Losing streak math decides your maximum size
Traders size for their expectancy and ignore the sequence. Expectancy tells you where 200 trades end. It says nothing about the order they arrive in, and the order is what closes accounts.
With a 55% loss rate, the expected number of eight-loss runs inside 100 trades is about 0.36, which puts the probability of seeing at least one near 30%. Over a year of active trading, that run is not a tail event. It is scheduled. So the only question that matters is what an eight-loss run does to your equity, and the answer is fixed by your risk per trade percentage:
At 1% risk, eight losses cost 7.7%. At 2%, 14.9%. At 3%, 21.6%. At 5%, 33.7%. The first two are noise on a positive-expectancy system. The last one requires a 50.8% gain to get back to flat, and no small account recovers 50.8% while its owner is scared of the next trade.
Position sizing small trading account rules that survive eight losses
The process below is a sizing audit, not a philosophy. Every step produces a number you can check.
Calculate your dollar risk cap first: 1.5% of current equity, recomputed every Monday off the closing balance.
Compare that cap to the smallest position your instrument allows at your normal stop distance, and reject the instrument if one unit exceeds the cap.
Filter your last 50 trades by dollar risk divided by same-day equity, then confirm the series is flat rather than rising.
Cap total open correlated risk at 1.5%, so three long index-correlated positions share one risk unit instead of three.
Eliminate any setup where round-trip fees exceed 5% of your average R, because on a $50 risk unit that drag turns a 0.17R edge into 0.12R.
Review the deepest eight-trade window in your history and confirm it cost less than 15% of equity at the time.
Metric | What it actually means | Action to take |
|---|---|---|
Worst 8-trade window costs 14.9% or less | Your sizing survives a normal losing streak with room to keep trading. | Change nothing. Leave the size alone through the next run. |
Worst 8-trade window costs 30%+ | You need a 42.9% gain to recover, which your expectancy cannot deliver quickly. | Halve position size immediately, before the next setup. |
Risk per trade percentage rising while equity falls | Sizing drift. You are betting bigger relative to capital as the account shrinks. | Recompute unit size weekly off current equity, not starting equity. |
Smallest tradable unit exceeds 2% of equity | The instrument, not your discipline, is setting your risk. | Move to a smaller-multiplier product or widen the stop and cut frequency. |
Fees above 5% of average R | Structural drag that no entry improvement removes. | Trade fewer, larger-R positions or drop the setup entirely. |
A $5,000 account through a real eight-loss run
Take a trader with a genuinely positive edge: 45% win rate, average winner 1.6R, expectancy +0.17R. Account is $5,000. Instrument is MES, stop is 20 points, so risk per trade is $100 and fees run about $1.20 round trip.
Trades 1 through 8 all lose. Equity is $4,150, down 16.2%. The edge is intact; the sequence just arrived badly. Now the two paths split.
Path one: the trader adds a second contract to recover faster. Risk per trade goes to $200, which is 4.8% of the reduced equity. A five-loss cluster ten trades later removes $1,000. Equity is $3,150, a 37% drawdown, and the account needs +58.7% to see $5,000 again. At +0.17R per trade on a $63 unit, that is over 90 clean trades away.
Path two: the trader recomputes on Monday. Risk cap is 1.5% of $4,150, or $62. One MES contract no longer fits, so the position moves to MNQ with a 30-point stop, risking $60. Over the next 32 trades the same edge produces roughly 32 × 0.17 × $60, or about $326, less fees. Equity is near $4,450 and the account is still in the game. Path two does not feel better. It just remains solvent, which is the only comparison that pays.
Divide each of your last 50 trades' dollar risk by the account equity on that date. If that percentage trends up while your equity curve trends down, you are not in a strategy drawdown — you are in a sizing failure, and no entry refinement will fix it.
Where small accounts actually blow up
Counting correlated positions separately. Three long tech names at 1% each is a 3% single-idea bet. One gap down and the eight-loss math arrives in a single session.
Sizing off peak equity. A trader who anchors unit size to the $5,800 high while trading a $4,200 balance is running 38% more risk than the plan states.
Tightening stops to fit the size. Shrinking a 20-point stop to 10 points to keep one contract inside a $50 cap does not reduce risk. It raises loss frequency and destroys win rate, which is a slower version of the same drawdown.
Adding to a loser to lower average price. On a small account this converts a defined 1.5% loss into an undefined one, and the re-entry timestamp usually shows the decision took under 90 seconds.
Cutting size after a win and raising it after a loss. Check your own average risk on trades following a loss. If it is higher than average risk following a win, your sizing is emotional, not systematic.
Where TradeOlogy fits
Sizing drift is a data problem before it is a discipline problem, and it hides in spreadsheets. Connect a brokerage account or import a CSV, and TradeOlogy builds round trips from your fills, so dollar risk, R-multiple, and drawdown are computed against the equity you actually had on each trade date rather than a number you typed in once.
The useful views are narrow. Sort your worst rolling eight-trade windows and check the equity cost of each. Break expectancy down by setup tag to see whether the drawdown came from one leaking setup or from every setup at a size the account could not carry. Filter by session and hour, since a stop that fits at 10:30 rarely fits at 15:50. If you want the underlying framework in full, the position sizing guide covers the mechanics, and the futures journal column that exposes bad sizing shows the specific field most traders omit. For the review cadence itself, see rebuilding a trade review process. Free trial, cancel anytime.
FAQ
What risk per trade percentage survives an eight-trade losing streak on a $5,000 account?
1% to 1.5%. Eight consecutive losses at 1% cost 7.7% of equity and at 1.5% cost 11.4%, both of which a positive-expectancy system recovers inside a few dozen trades. At 5%, the same run costs 33.7% and demands a 50.8% gain to break even.
Why does my effective risk climb during a drawdown even though I never changed size?
Because your position size is fixed in contracts or shares while the denominator shrinks. A $100 risk unit is 2.0% at $5,000 and 2.9% at $3,500. Recompute unit size from current equity on a set schedule, weekly at minimum, or the account sizes up as it falls.
Should I cut position size after every individual loss?
No. Trade-by-trade resizing on a small account chops your winners down to nothing, because the largest wins land unpredictably in the sequence. Resize on equity thresholds instead: a fixed reduction at -10% and another at -20% from the last recomputation point.
How many correlated positions can a $5,000 account hold at 1.5% risk each?
One, in risk terms. Two long positions in the same sector or index typically move together on the days that matter, so treat them as a single 1.5% unit split across two tickers. The difference in R behaviour between small and large caps matters more than the ticker count.
Is a wider stop with a smaller position better than a tight stop on a full-size position?
On a small futures account, usually yes, because the minimum contract already sets a floor on dollar risk. A wider stop with fewer contracts holds the same dollar risk while raising win rate, which is the same trade-off that separates swing sizing from day sizing.
The standard to hold yourself to
Open your journal and find the worst eight consecutive trades you have ever taken. Divide that dollar loss by the equity you held at the start of that run. If the number exceeds 15%, your current size is too large for the streak that is already priced into your win rate, regardless of how good the setups look.
Verdict: position sizing on a small trading account is not a percentage you choose once, it is a number you recompute against falling equity — and the accounts that die do so because a fixed contract count turned a routine eight-loss run into a 30% drawdown. Size for the streak, recompute weekly, and the edge gets time to work.