

Small cap vs large cap trading is the same set of setups run across two different liquidity tiers, where small caps offer wider ranges and thinner books while large caps offer tighter spreads and more repeatable fills. Most traders compare the two on gross R and conclude small caps pay better. They do pay better on the winners. The problem is that the losers do not settle at the price you planned, and the gap between planned risk and realized risk is where an entire year of small-cap expectancy quietly disappears.
Why traders compare small cap vs large cap trading on the wrong axis
The standard comparison is range. Small caps move 15% in a session, mega-caps move 1.2%, so the small-cap trader assumes a structurally larger R-multiple per trade. That part is true and it is also irrelevant on its own.
R-multiples assume your risk denominator is fixed. It is not. Your denominator is whatever price your stop actually filled at, not the price you typed into the ticket. On a stock with a $300M float and 40,000 shares on the bid, a market stop during a flush does not fill at your level. It fills three cents lower, sometimes fifteen. Your journal records a loss. Your R calculation records -1R because that is what you planned. The two numbers disagree, and only one of them left your account.
Large caps hide the problem in the other direction. Fills are honest, so traders size up because it feels safe, then hold through adverse excursion they would never tolerate on a runner. The consequence is different but equally measurable: a book with a 51% win rate and expectancy under 0.05R per trade, going nowhere while looking disciplined.
The loss inflation ratio, and why it decides this comparison
Take every losing trade in a book. Divide the realized loss by the planned risk on that trade. Average the result. Call it the loss inflation ratio.
On liquid large caps that number sits between 1.00 and 1.05. On small caps it routinely runs 1.15 to 1.30. That asymmetry is not random, and it is not bad luck. Winners on small caps get good fills because you are selling into demand that just carried the stock up. Losers get bad fills because you are selling into a bid that has already stepped away. Slippage is one-directional by construction.
The consequence is specific. A book showing 0.21R gross expectancy with a 1.22 loss inflation ratio is really running near 0.08R. That is not a rounding error, it is a two-thirds cut. And because the distortion hits only the loss side, R-multiple data computed from planned stops will never show it. Your win rate stays identical. Your average win stays identical. Only expectancy and profit factor move, and most traders never break either metric out by market cap tier.
Head-to-head: what each book actually costs
Dimension | Small caps | Large caps |
|---|---|---|
Gross R per winner | Larger, commonly 1.8R to 3R on momentum continuation | Smaller, commonly 1.0R to 1.6R on the same structure |
Loss inflation ratio | 1.15 to 1.30, driven by stop fills into a thin bid | 1.00 to 1.05, effectively planned risk |
Expectancy at scale | Degrades as share count rises against available liquidity | Stable, size is rarely the binding constraint |
Symbol reuse | Low, the ticker list rotates weekly with the catalyst | High, the same 20 names repeat for years |
Sample quality for analytics | Poor, each symbol has too few round trips to judge | Strong, per-symbol profit factor becomes meaningful fast |
Overnight gap exposure | Severe, offerings and dilution price without warning | Moderate, gaps cluster around scheduled events |
Notice the fifth row. It is the one nobody weighs. Trade analytics by symbol only produces a verdict when a symbol has enough round trips behind it. A large-cap trader hits 40 trades in NVDA within a quarter and can state, with evidence, whether that ticker pays. A small-cap trader has six trades in a ticker that no longer trades 5M shares a day, and never gets an answer before the name goes cold.
The review process that settles it in your own data
Do not argue this from theory. Split your closed trades and run the numbers.
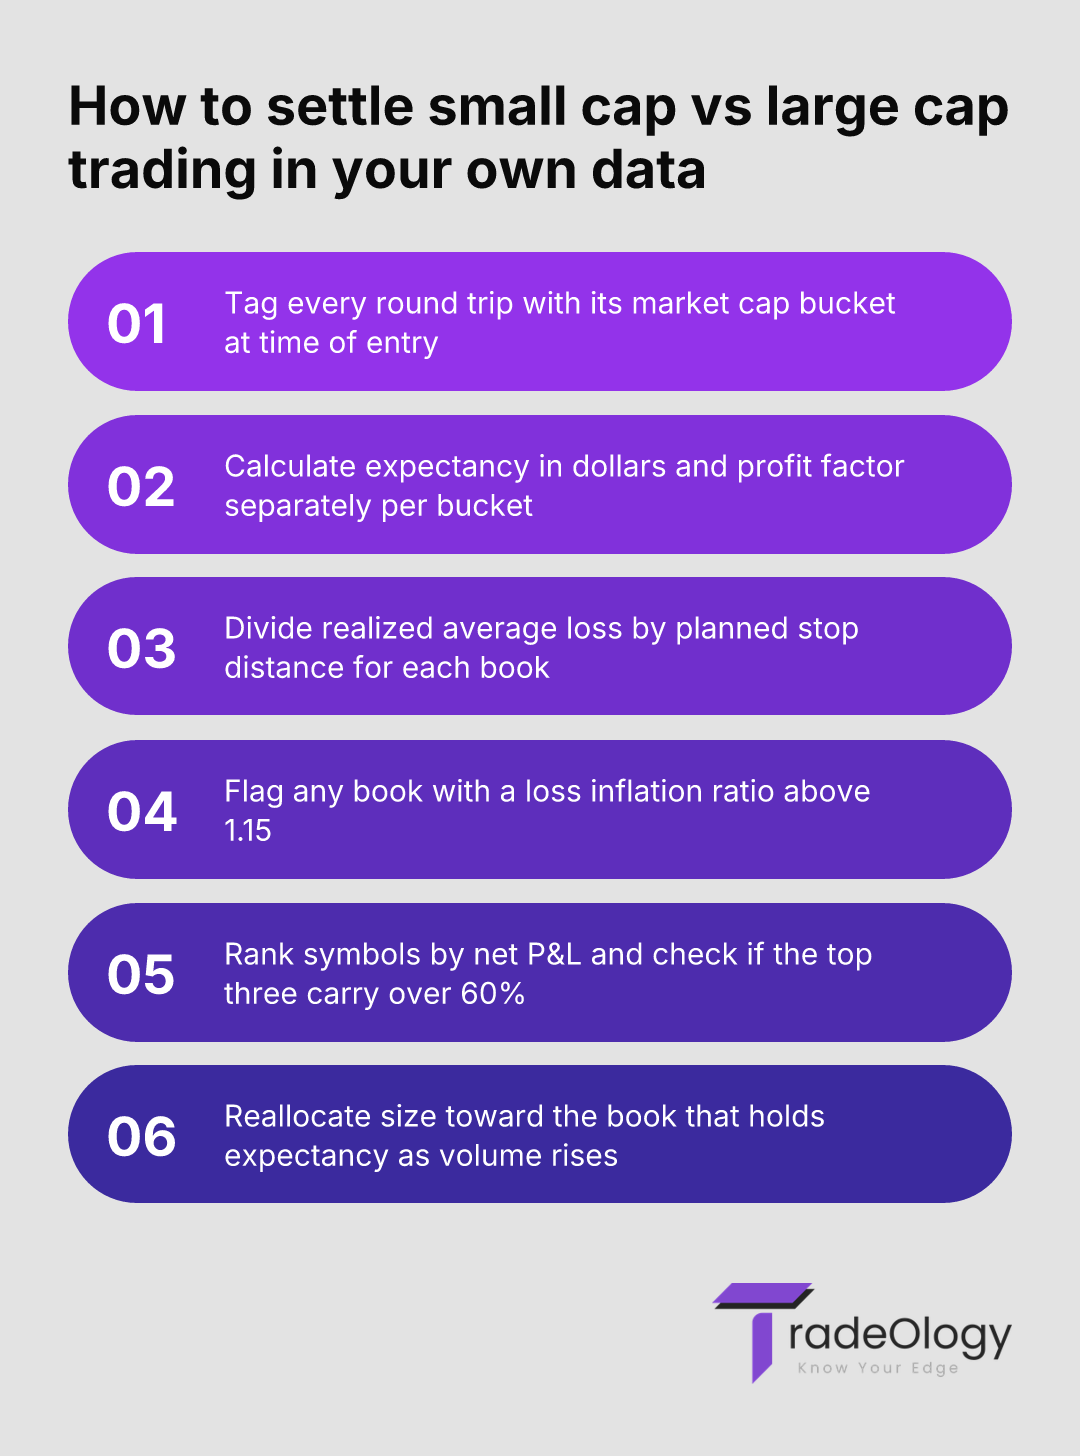
Tag every round trip with a market cap bucket at time of entry: under $2B, $2B to $10B, above $10B.
Calculate expectancy in dollars per trade and profit factor separately for each bucket, not for the account as a whole.
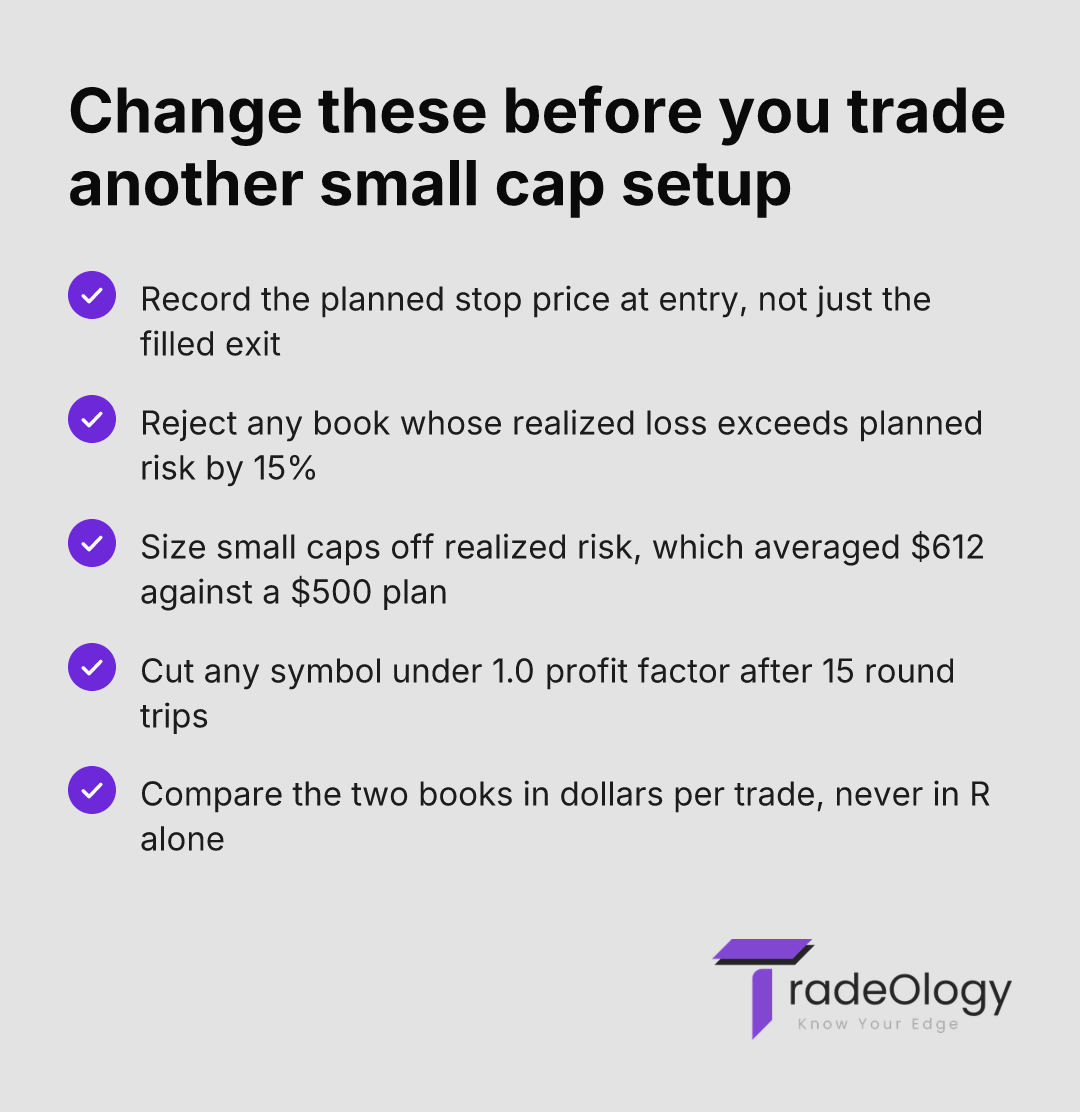
Compare realized average loss against your planned stop distance per bucket to get the loss inflation ratio.
Rank symbols inside each bucket by net P&L and check whether the top three carry more than 60% of the total.
Eliminate any symbol sitting below 1.0 profit factor after 15 or more round trips.
The fourth item is the one that stings. If three tickers produced most of your small-cap year, you did not find an edge. You caught three moves, and the other 100 trades were paid for by them.
Metric to meaning
Metric | What it actually means | Action to take |
|---|---|---|
Loss inflation ratio above 1.15 | Your stops fill outside your risk plan, so every R figure you hold is overstated. | Size small caps off realized risk, not the stop you intended. |
Profit factor < 1.2 with average win above 2R | Sizing and exit slippage, not setup selection, is eating the edge. | Halve share count on sub-$2B names and re-measure over 30 trades. |
Top three symbols carrying 60%+ of net P&L | You have a small sample of good luck dressed as a strategy. | Recompute expectancy with those three symbols removed. |
Large-cap win rate above 50%, expectancy under 0.05R | You are cutting winners at the same speed you cut losers. | Extend the first target by 0.5R and track the change in profit factor. |
A worked example: 260 trades, two books
A $50,000 account, risking 1% per trade, so $500 of planned risk per position. Twelve months, two books.
Small caps: 120 trades, 49 winners at an average of $980, 71 losers at an average of $612. Gross profit $48,020, gross loss $43,452, net $4,568. Profit factor 1.11. Expectancy $38 per trade.
Large caps: 140 trades, 66 winners at an average of $690, 74 losers at an average of $515. Gross profit $45,540, gross loss $38,110, net $7,430. Profit factor 1.20. Expectancy $53 per trade.
The small-cap book won bigger on every winner and still finished $2,862 behind on 20 fewer trades. Now price the leak. Had those 71 small-cap losers stopped at the planned $500, gross loss would have been $35,500 and net would have been $12,520 with a profit factor of 1.35. The difference is $7,952, or about $112 per losing trade, paid to the bid that was not there.
That is the whole argument. The small-cap setup was better. The small-cap execution was $7,952 worse. Nothing in the trader's setup notes would have revealed it, because the setup was never the problem.
If your realized average loss is more than 15% larger than your planned stop distance, your small-cap expectancy is not an edge you have found. It is an invoice you have not opened.
Common mistakes in this comparison
Comparing the two books in R instead of dollars, which hides slippage entirely because R is calculated from the stop you planned.
Judging a small-cap symbol on eight round trips, then declaring the ticker "good for me" on a sample that proves nothing.
Increasing small-cap size after a strong month, when the liquidity that produced the fills has not increased with it.
Treating a 51% win rate on large caps as competence while expectancy sits at 0.04R and commissions take the rest.
Running one blended equity curve across both books, so the profitable one funds the losing one indefinitely.
Who should pick which
The trader who screens catalysts pre-market, sits at the desk for the first 90 minutes, and closes flat by 11:00 should stay in small caps, with size capped so that no order exceeds a fixed share of the average one-minute volume. That trader is paid for attention and speed, and the loss inflation ratio is a cost of doing business they must price in rather than eliminate.
The trader who holds two to ten days, works a day job, or scales into positions should be in large caps. Slippage is the enemy of anyone who cannot watch the tape, and multi-day exposure on a thin float turns dilution risk into a position-sizing question you cannot answer in advance. The holding-period and sizing relationship decides this more than any preference for volatility.
Both books carry real costs. Small caps hand you a wider distribution of outcomes and a permanently unfavourable stop-fill asymmetry, and the SEC has documented the promotion and liquidity risks in microcap names for a reason. Large caps hand you honest fills and a thin edge that dies the moment your commissions and cutting habits exceed 0.05R per trade. Neither is a safe default.
Where TradeOlogy fits
Connect a brokerage account or import a CSV, and your executions get reconstructed into round trips. From there you can filter by symbol, setup, session and hour, and read expectancy, profit factor, win rate and drawdown for each slice independently. Tag your market cap buckets and the two books separate immediately, including the equity curve dip that appears in the small-cap slice while the blended curve still slopes up.
The honest limitation: the loss inflation ratio needs your planned stop, and no broker feed carries an intention. If you do not record the stop price at entry, we can show you realized losses but not the gap between planned and realized. CSV files that report a single averaged fill also collapse partial exits, so scaled-out trades lose granularity. A tagging habit is the difference between analytics that answer this question and analytics that only describe your P&L. That distinction is the same one covered in journal versus trade log. The free trial requires a card and you can cancel anytime.
FAQ
Why is my small-cap profit factor lower than my large-cap profit factor when my winners are bigger?
Because profit factor divides gross profit by gross loss, and your gross loss is inflated by stop fills that landed past your intended price. Bigger winners raise the numerator, but a 1.22 loss inflation ratio raises the denominator faster. Check realized average loss against planned stop distance before blaming the setup.
How many trades per market cap bucket before the comparison means anything?
Aim for at least 50 closed round trips per bucket, and 100 before you reallocate capital. Below 30, one outsized winner swings expectancy by 0.1R on its own. The loss inflation ratio stabilises faster than expectancy, so you can read that number credibly at around 25 losing trades.
Does trade analytics by symbol change how I should size small caps?
Yes, but only through liquidity, not through the symbol's history. Cap each order at a fixed percentage of the name's average one-minute volume, then check whether your realized loss inflation drops toward 1.05. If it does, your sizing was the constraint, not your entries.
Should I trade small caps at all if slippage takes that much of the edge?
Only if the setup's gross expectancy clears the slippage with room left. A book running 0.25R gross and 1.20 loss inflation still nets positive. A book running 0.10R gross does not survive contact with the bid, and no amount of screen time fixes that arithmetic.
The standard for small cap vs large cap trading
Stop running one equity curve. Split the book, record your planned stop on every entry, and hold each side to expectancy in dollars per trade rather than R. If the small-cap side cannot clear its own slippage over 50 trades, it does not deserve capital next quarter, however good the charts looked.
Verdict: small cap vs large cap trading is decided by realized risk, not by range. Whichever book keeps its loss inflation ratio under 1.15 while holding positive expectancy at your current size is the one that should hold your capital, and the other one is a hobby you are financing.