

Revenge trading is re-entering the market immediately after a loss in order to win that money back, and it leaves a measurable signature in trade data: an abnormally short gap between a losing exit and the next entry. Most traders hunt for that signature in the wrong column. They scan their log for oversized positions, find none, and decide they are disciplined. The size escalation usually arrives later, on the third or fourth trade. The second trade — the actual revenge trade — is frequently the same size as everything else. That is exactly why it survives every risk review you run.
Why revenge trading hides from your own review
Traders look for emotion in a spreadsheet. Emotion has no column. So the review turns into a memory exercise, and memory conveniently forgets the trade you took ninety seconds after a stop-out.
The second problem is resolution. Most loss streak analysis happens at the day level: red day, green day, weekly P&L. At that resolution the revenge trade nets out inside the day's total. A $500 stop-out followed by a $180 grab-back followed by a $420 loss reads as a $740 red day. Nothing flags. You conclude the market was choppy.
Then comes the wrong fix. The trader writes a size rule — never exceed 1% risk — and the rule holds, because the revenge trade never breached it. Trading discipline gets measured against a constraint that was never the leak. Six months later the equity curve still has the same repeating stair-step down, and it still starts at the same point: the trade after the loss.
The two columns that actually expose it
Add one field to your log: seconds elapsed between the previous exit and this entry. Then filter for entries that followed a losing exit by under three minutes. That cohort is your revenge book, whether or not you felt anything at the time.
Now look at what the cohort does, and prepare to be annoyed. Across the traders' data I have reviewed, that cohort tends to post a win rate at or slightly above baseline — 47% against 44% is a typical spread — while its expectancy sits negative. Win rate goes up. The money goes down.
The mechanism is exit behaviour, not selection. A trader who just lost $500 is not trying to run a 2R winner. He is trying to get flat and whole. So he takes the first green print. Average winner in the cohort drops from roughly 1.9R to somewhere under 0.8R, while losers stay full size at 1R. That is R compression, and it is why R-multiple data separates skill from variance better than any hit-rate figure. On your own dashboard, look at the R-distribution histogram for post-loss entries and compare where the right tail ends against your full sample. If the tail is amputated at 1R, you have your answer.
A five-filter review you can run this week
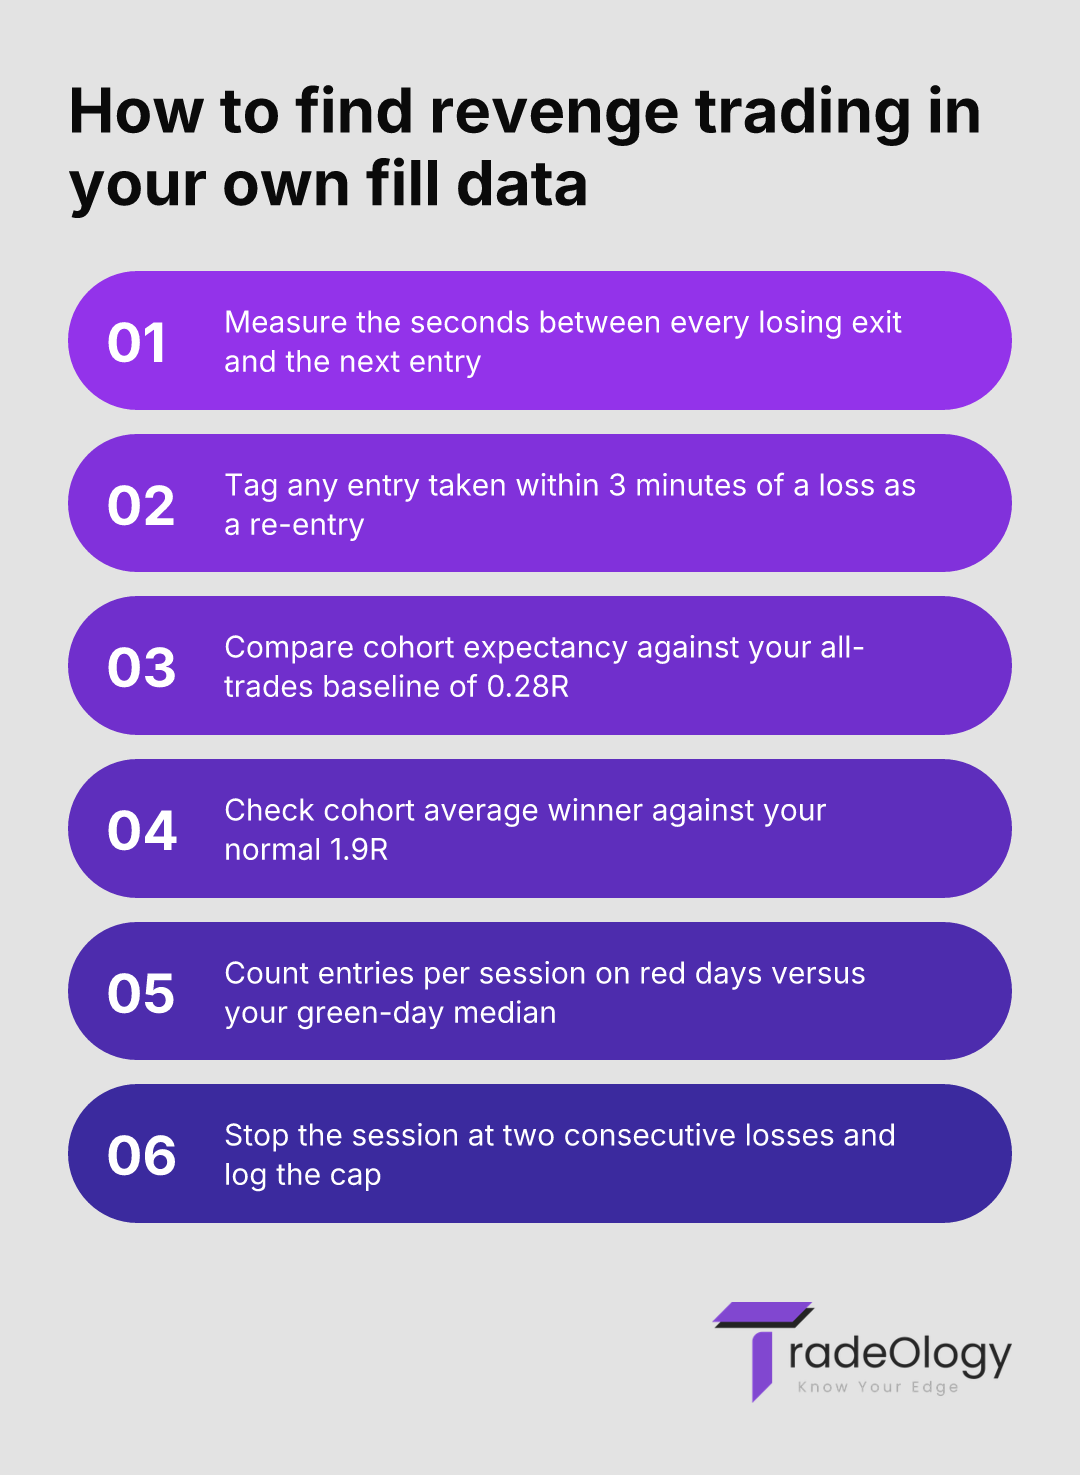
This is loss streak analysis at trade resolution instead of day resolution. Work through it once with 90 days of fills.
Tag every entry that followed a losing exit by under three minutes as a re-entry.
Calculate expectancy in R for that cohort and compare it to your all-trades baseline.
Compare average winner in R between the cohort and baseline — expect a gap of 1R or more.
Count entries per session on red days against your green-day median to size the overtrading effect.
Review the third trade after any two-loss sequence and check its risk against your standard unit.
Filter four is where overtrading gets quantified rather than confessed. If your green-day median is four entries and your red-day median is eight, the extra four trades are not opportunity. They are the same trade attempted repeatedly at declining quality. Barber and Odean's work on turnover and individual investor returns put a number on that relationship long before any of us had a dashboard.
What each number is telling you
Metric | What it actually means | Action to take |
|---|---|---|
Gap to next entry under 3 minutes after a loss | The entry answered the last exit, not a signal. | Tag the cohort and measure its expectancy separately. |
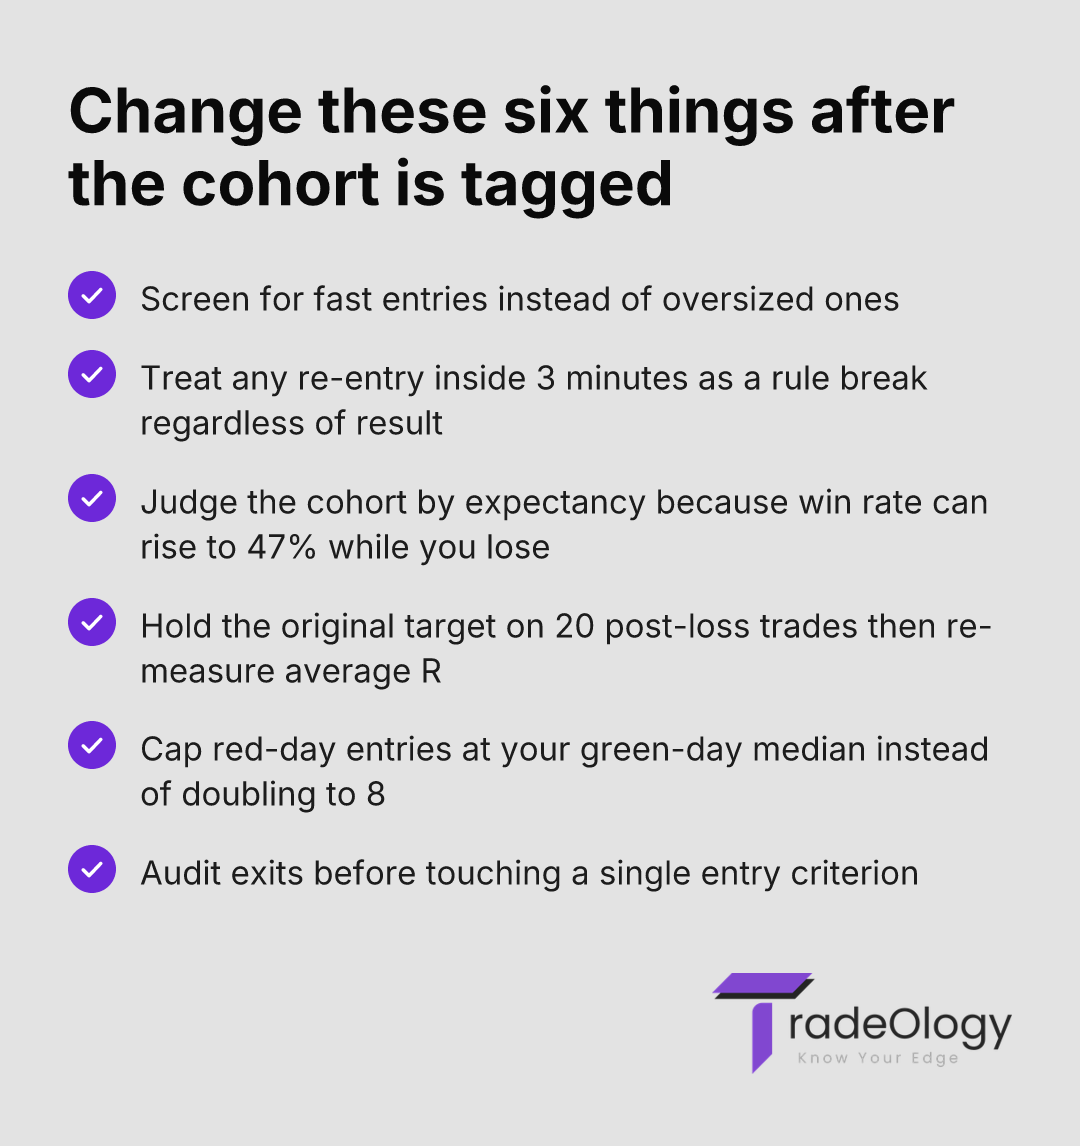
Cohort average winner below 1.0R | R compression from grab-back exits, not bad entries. | Hold the original target on the next 20 post-loss trades. |
Win rate flat or higher while expectancy is negative | The problem is on the exit side of the trade. | Freeze entry rules and audit exits only. |
Red-day trade count 2x green-day median | Overtrading is how the loss chase gets executed. | Hard-cap session entries at your green-day median. |
Third trade after two losses sized above 1.5x unit risk | Sizing escalation has begun and drawdown is now nonlinear. | Stop for the session at two consecutive losses. |
What it costs on a $50,000 account
Take a $50,000 futures account risking 1% per trade, so $500 a unit. Baseline over 200 trades: 44% win rate, average winner 1.9R, average loser 1.0R, expectancy 0.28R. That is $140 per trade, and a real edge.
Now isolate the re-entry cohort from one month of 200 trades. Thirty-eight of them — 19% of the sample — were entered inside three minutes of a losing exit. Win rate on those 38: 47%. Average winner: 0.74R. Average loser: 1.05R. Expectancy: negative 0.21R, or minus $105 per trade. That cohort gave back $3,990.
The other 162 trades earned 0.40R each, which is $32,400 of gross R value at $500 a unit — call it $32,400 × 0.40... in plain dollars, $200 per trade, or $32,400 total. The month closed up roughly $28,400 instead of $32,400. Nothing blew up. The account still grew. The trader still cannot explain why his monthly numbers keep landing 12% under what his backtest says. The answer is 38 timestamps.
Scale that down to a $10,000 account risking $100 and the arithmetic is identical in R terms. Revenge trading is not a beginner's problem that disappears with account size. It is a latency problem, and latency does not care what your equity is.
If entries taken within three minutes of a losing exit show a higher win rate than your baseline and a lower expectancy, your problem is not entry selection or emotion — it is that you close winners early when you are trying to get even, and no entry filter will repair that.
Mistakes that keep the pattern invisible
Reviewing P&L by day instead of by sequence. Daily netting hides the exact trade that broke the process.
Screening only for oversized risk. Roughly two-thirds of revenge entries are sized normally, so a size filter clears them.
Judging the cohort by win rate. Win rate frequently improves, which convinces the trader nothing is wrong.
Tagging by feeling after the session. A timestamp is objective; "I was tilted" is a story you write later.
Treating a two-loss stop rule as optional. Skipping it once per month is enough to reintroduce the whole cohort.
Blaming volatility. Check whether the cohort clusters into one hour. If it does, read how a single hour drains an edge before you blame the tape.
Where TradeOlogy fits
Connect a brokerage account or import a CSV and your executions get rebuilt into round trips with entry and exit timestamps intact. That is the raw material for this whole exercise — you cannot compute time-to-re-entry from a P&L summary.
From there, tag the fast re-entries as their own setup and let the platform report expectancy, profit factor, and average R per side for that tag against everything else. The hour-of-day and session breakdowns tell you whether the cohort concentrates after the open or in the last hour, which decides whether you need a stop rule or a session rule. For the sizing half of the problem, pair it with the discipline outlined in our position sizing guide, and set a fixed weekly slot to run the filters — when you review matters more than how long you spend. Stocks, options, futures, and crypto all feed the same log. Cancel anytime.
None of this stops you from clicking. It removes the excuse. Once the cohort has a number attached, the journal stops being a diary and starts functioning as a constraint.
FAQ
How short does the gap between trades have to be to count as revenge trading?
Three minutes is a workable default for intraday futures and stocks, because it is shorter than the time any discretionary setup needs to form and confirm. Scale it to your holding period: a swing trader should test same-day re-entry after a loss instead. Run both thresholds and keep whichever splits expectancy more sharply.
Why does my win rate go up on revenge trades if they lose money?
Because you exit winners at the first green print to get whole, which converts what would have been 1.9R runners into 0.7R scratches. Losers stay full size at 1R or slightly worse. More trades close green, and the R math still ends up negative.
Does a daily loss limit solve overtrading after a losing streak?
A dollar limit stops the bleeding but teaches nothing, because it triggers after the damage. A two-consecutive-loss session stop is stricter and lands earlier in the sequence, before the sizing escalation on trade three. Measure both by comparing your max intraday drawdown before and after the rule.
How many trades do I need before the cohort expectancy is meaningful?
Thirty tagged re-entries gives a usable signal; 50 or more makes the average-winner gap hard to dismiss as variance. If your cohort is under 15 trades in 90 days, the pattern is not your primary leak — go look at session-level performance and holding time instead, as covered in our piece on sizing across holding periods.
The standard to hold yourself to
Stop asking whether you revenge trade. Filter the log, count the entries inside three minutes of a losing exit, and read the expectancy. If the number is negative and the sample exceeds 30 trades, you have a documented leak with a documented size, and the only remaining question is whether you enforce a two-loss session stop starting Monday.
Verdict: revenge trading is not a temperament to manage, it is a cohort in your data with a timestamp, an expectancy, and a dollar cost. Tag it by time-to-re-entry, fix the exits first, and expect to recover the 10-15% of annual return that cohort has been quietly consuming.