

A stock trading journal should record the fields that explain why a trade paid — setup tag, timestamp to the minute, planned stop and target set before the fill, maximum adverse and favourable excursion, exit reason, and size as a percentage of account risk — not just the two fill prices your broker already stores. Most traders skip every one of those and then wonder why six months of records produced no behavioural change. Fill prices tell you the outcome. They cannot tell you whether the outcome came from the setup, the stop placement, the hour, or your hands. That gap is where the money quietly leaks.
Why an entry-and-exit stock trading journal cannot diagnose anything
Entry price, exit price, share count, P&L. That is a statement, not a journal. Your broker generates it automatically, and it answers exactly one question: did this trade make money. Every question worth asking is upstream of that.
Traders default to price-only records because price feels objective and the rest feels like homework. The consequence is measurable. With only fills, you can compute win rate and profit factor, and nothing else. You cannot separate a bad setup from a good setup executed badly, so you end up rotating strategies every eight weeks while the actual defect — stop placement, sizing drift, one dead hour — survives every rotation intact. The distinction between a record of what happened and a record of what you decided is the whole point of a journal, and it is covered in more depth in Trading Journal vs Trade Log Difference.
The one field pair that exposes fake expectancy
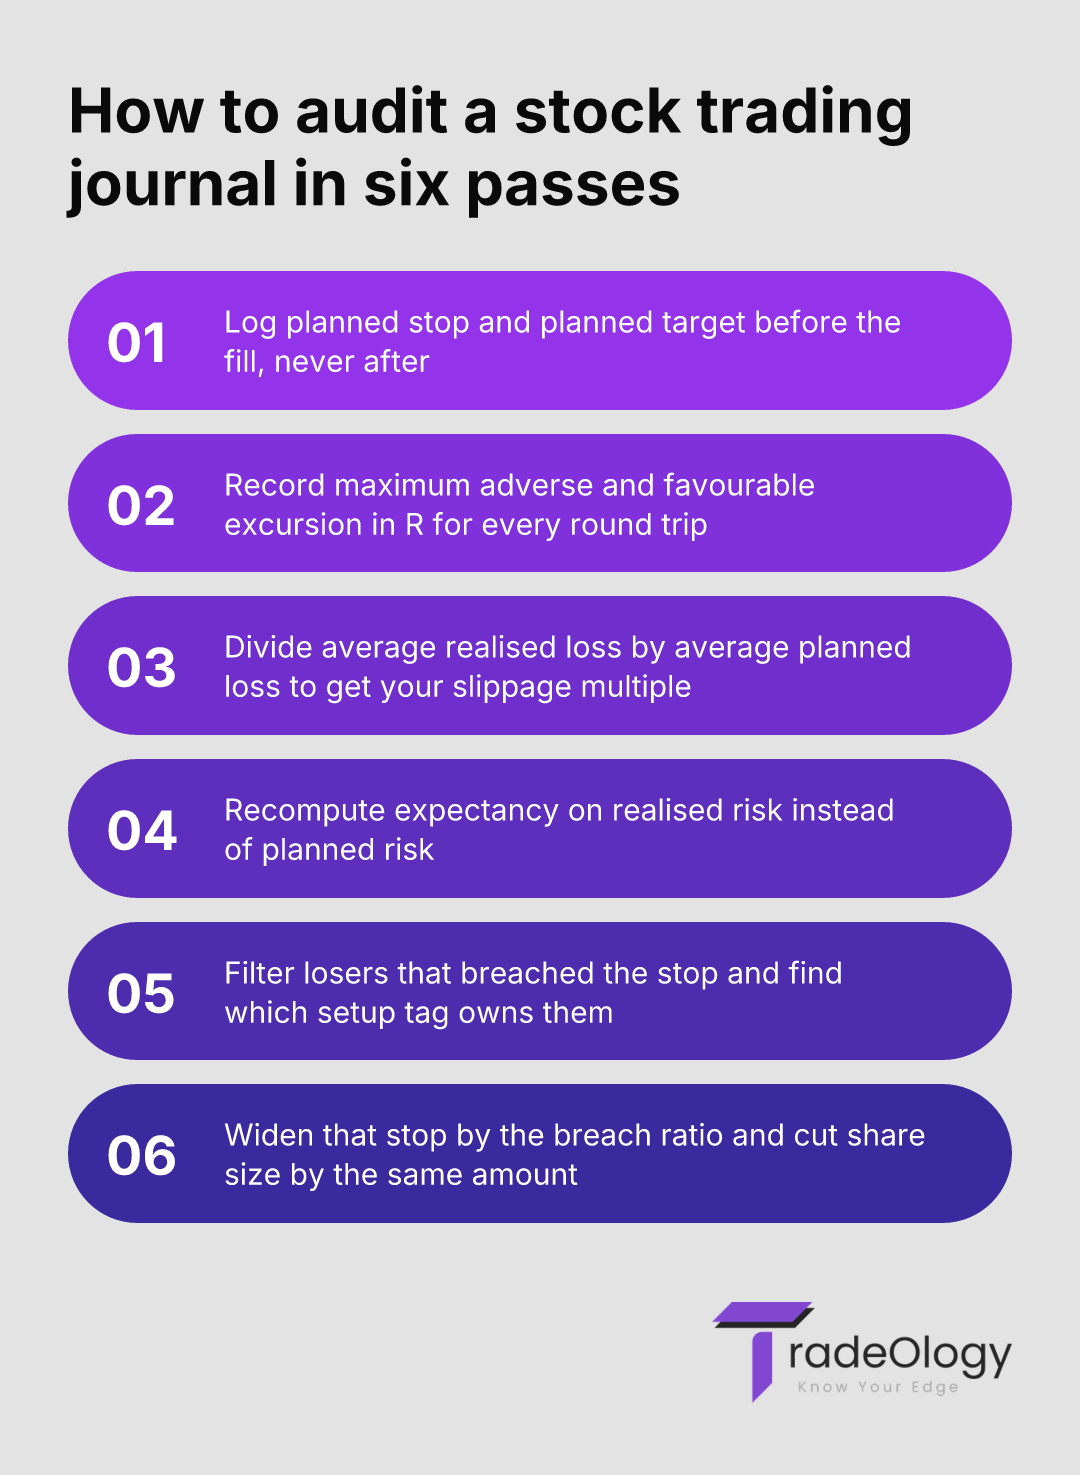
Here is the finding that price-only records physically cannot surface. Log two numbers per trade: the stop distance you planned before entry, and the price you actually exited at. Divide your average realised loss by your average planned loss. Call it the slippage multiple.
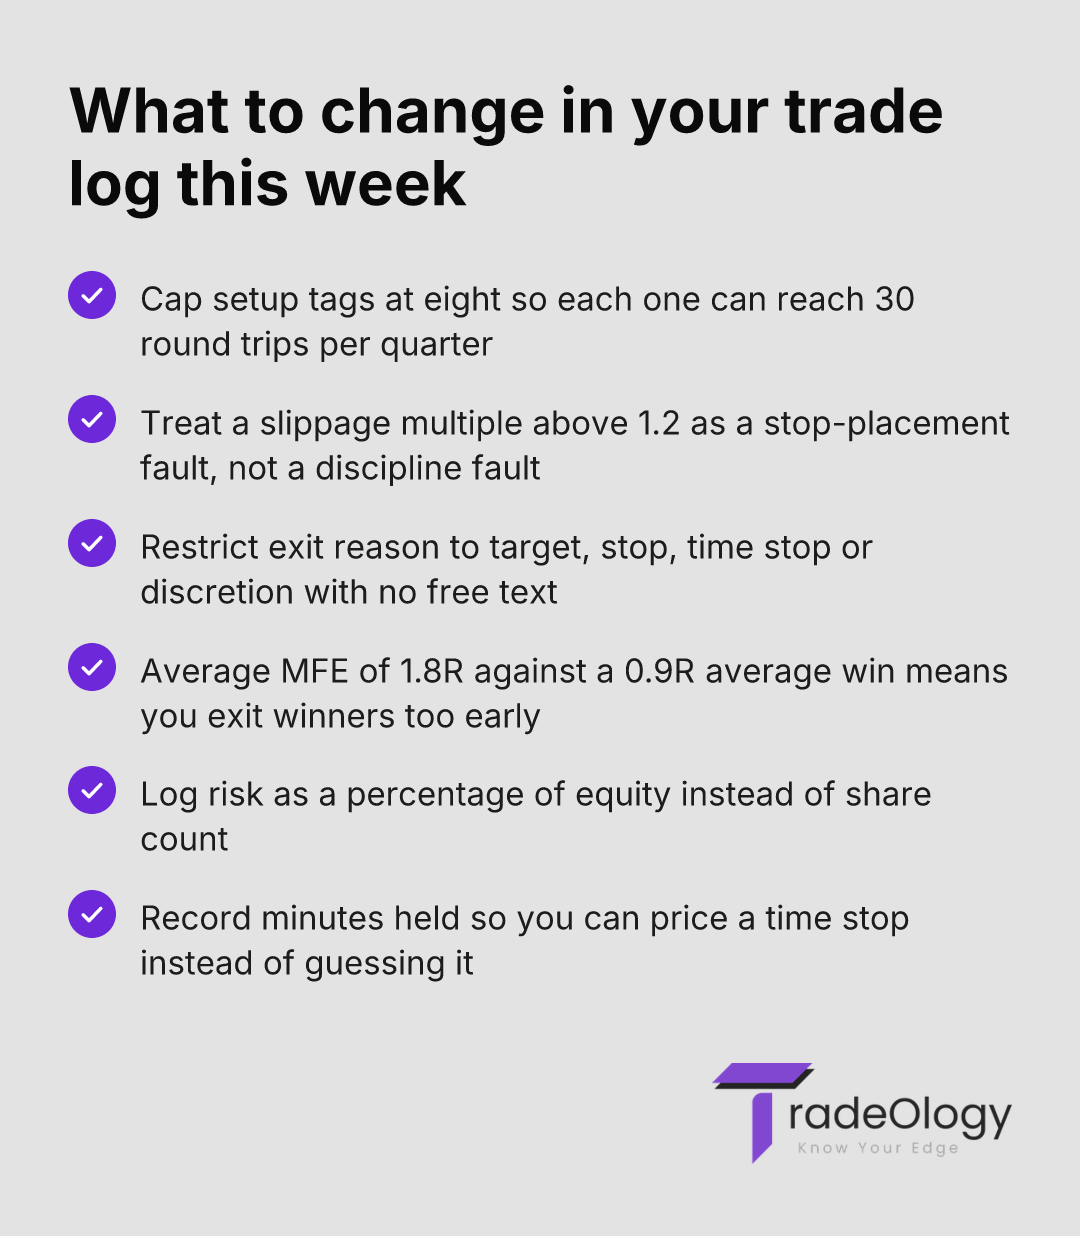
When that number sits above 1.2, the expectancy in your journal is fiction. R-multiples are almost always computed against planned risk, so a trader who plans to lose $375 and averages $505 is reporting every loss at 74% of its real size. A system logged at +0.18R per trade collapses to roughly +0.06R once you recompute against realised risk. The journal shows a rising expectancy line while the equity curve crawls sideways, and the trader concludes the edge decayed.
The edge did not decay. And the fix is not discipline. In nearly every case I have seen, the traders breaching stops are the ones whose stop sits inside the instrument's normal adverse excursion — the stop is placed where price routinely goes before resolving, so it gets hit, ignored, or moved. Widening the stop by the breach ratio and cutting share size by the same ratio holds dollar risk constant and stops the breaches at source. You cannot see any of this without recording planned stop, realised exit, and maximum adverse excursion side by side.
What actually belongs in the record
Eight fields carry information. Everything else is decoration.
Setup tag — one tag per trade, from a closed list of no more than eight. Overlapping tags destroy sample size.
Planned stop and planned target — entered before the fill, never edited afterwards.
Exit reason — target, stop, time stop, or discretion. Four options, no free text.
Maximum adverse excursion — the worst point the trade reached against you, in R.
Maximum favourable excursion — the best point it reached, in R.
Risk as a percentage of equity — not share count, which tells you nothing across account sizes.
Timestamp and minutes held — hour of entry, plus duration.
Fill quality — signal price versus actual fill, which matters more on thin names than most traders admit. The SEC's guidance on trade execution is worth reading once if you have never checked your own.
Setup Checklist
Tag every round trip with exactly one setup name from a fixed list of eight or fewer.
Calculate your slippage multiple monthly by dividing average realised loss by average planned loss.
Filter losers where exit reason equals stop and MAE exceeded planned risk, then check which tag owns them.
Compare average MFE against average realised win per setup to price your exits honestly.
Eliminate any setup tag with fewer than 30 round trips from your performance conclusions.
Reading the fields once you have them
Metric | What it actually means | Action to take |
|---|---|---|
Slippage multiple > 1.2 | Your logged expectancy overstates reality by roughly the same factor. | Widen the stop by the breach ratio and cut size by it. |
Median MAE on winners < 0.4R | Your stop is far wider than winners ever need. | Tighten the stop to 0.6R and size up to hold risk flat. |
Average MFE 1.8R, average win 0.9R | You are surrendering half of every move you correctly caught. | Trail from 1R instead of exiting at a fixed target. |
Exit reason "discretion" on > 25% of trades | Your results measure your mood, not your system. | Force target or stop exits for 20 trades and compare expectancy. |
Setup tag with 11 trades and 64% win rate | Noise. The confidence interval spans loss and profit. | Keep risk at 0.25% on it until sample passes 30. |
A worked example: $50,000 account, 68 trades
A swing trader running a $50,000 cash account risks 0.75% per position, or $375. Across Q1 2026 he took 68 round trips. His journal reported expectancy of +0.18R, which implies roughly $4,590 of profit. His statement showed $1,540 net.
The gap sat in one column he had only started recording in January: realised exit versus planned stop. Average planned loss was $375. Average realised loss was $505 — a slippage multiple of 1.35. Recomputed on realised risk, expectancy was +0.06R, which matches the $1,540 almost exactly.
Then the setup tag did the rest. Of 24 losers, 19 breached the planned stop, and 17 of those 19 carried the same tag: gap continuation. Median MAE on that tag was 1.4x the stop distance, meaning price routinely travelled 40% past his stop before resolving in either direction. He was placing stops inside normal noise on that setup alone. His other three tags had a slippage multiple of 1.03.
The correction was arithmetic, not psychological. On gap continuation only, he widened the stop 40% and cut share size 40%, holding dollar risk at $375. Over the following 41 trades the slippage multiple came in at 1.04 and expectancy on realised risk read +0.16R. Same setups, same win rate within two points, roughly triple the return per unit of risk. If the expectancy arithmetic here is unfamiliar, work through calculating and improving trading expectancy before touching your sizing.
If your average realised loss exceeds your average planned loss by more than 20%, the expectancy in your journal is fiction and your stop is sitting inside the instrument's normal adverse excursion — no amount of discipline fixes a stop placed in the wrong location.
Mistakes that survive years of journalling
Editing the planned stop after entry. The pre-trade number is the only one with diagnostic value. Overwrite it and you have destroyed your own control group.
Free-text setup names. "Pullback", "pullback long", and "PB continuation" fragment 60 trades into three useless buckets of 20.
Logging emotion without logging behaviour. "Felt anxious" is unfilterable. "Cut at 0.4R with target untouched" is filterable, and it captures the same event.
Ignoring MFE. Traders obsess over losses and never measure how much of each winner they gave back. That is usually the larger number.
Recording share count instead of risk percentage. After the account grows 30%, share count tells you nothing about whether sizing stayed consistent.
Reviewing trade by trade. Single trades are noise. Reviews only produce decisions when you filter groups of 30 or more.
Where automated capture actually helps
Fill data should never be typed by hand. TradeOlogy pulls executions from a connected brokerage account or a CSV import, stitches partial fills into round trips, and computes expectancy, profit factor, win rate and drawdown from the resulting execution data across stocks, options, futures and crypto. That removes the transcription errors that quietly corrupt R-multiple math.
What it cannot do is invent your intent. Setup tagging, planned stop, and exit reason are yours to enter, and they are the fields that turn a pile of fills into a diagnosis. Once tagged, the breakdowns by setup, session and hour do the filtering — the histogram bar where win rate drops under 40%, or the equity curve dip that lines up with one tag, becomes obvious in seconds instead of over a weekend with a spreadsheet. For a broader view of what tooling changes and what it does not, read what trading journal software can and cannot fix. If you run several instruments, keeping all four asset classes in one log stops you comparing incompatible spreadsheets.
FAQ
Why does my journal show positive expectancy while my account stays flat?
Almost always because R is computed against planned risk while your actual losses run larger. Divide average realised loss by average planned loss. If the result is 1.3, your true expectancy is roughly a third of what you think it is.
How many trades does a setup tag need before the numbers mean anything?
Thirty round trips is the working minimum for direction, and 100 before you size up meaningfully. At 11 trades a 64% win rate is indistinguishable from a coin flip. Cap risk at a quarter of normal until the sample matures.
Do I need to record maximum adverse excursion manually?
Yes, unless your platform captures intraday extremes per position. Read it off the chart during your review and log it in R, not dollars. It is the single field that tells you whether a stop got hit because you were wrong or because the stop was in the wrong place.
How should a trade log template handle scaled entries without distorting R-multiples?
Record each fill separately but calculate R against the volume-weighted average entry and the original planned stop. Averaging into a loser moves your entry but does not reset your risk, and treating each add as a fresh 1R trade is how traders hide a doubling of position risk from themselves.
Is recording emotion in a journal worth the time?
Only when paired with a behavioural field you can filter on. Log the action — early exit, size increase, skipped signal — and the emotional label becomes searchable evidence rather than a diary entry. See the pro trader's guide to the trading journal for how to structure that pairing.
The standard to hold yourself to
A stock trading journal earns its keep when it can answer one question in under two minutes: which of my recorded decisions cost me the most money last quarter, and by how much. If your record cannot answer that, it is a tax receipt. Add planned stop, exit reason, MAE, MFE and one setup tag per trade, then run the slippage multiple at the end of every month.
Verdict: A stock trading journal built only from entry and exit prices can measure results but cannot locate causes, which is why traders keep swapping strategies while the same stop-placement fault drains every one of them. Record planned risk, adverse excursion, exit reason and a single setup tag, and the defect usually turns out to be one tag and one arithmetic correction away from fixed.